


TL;DR
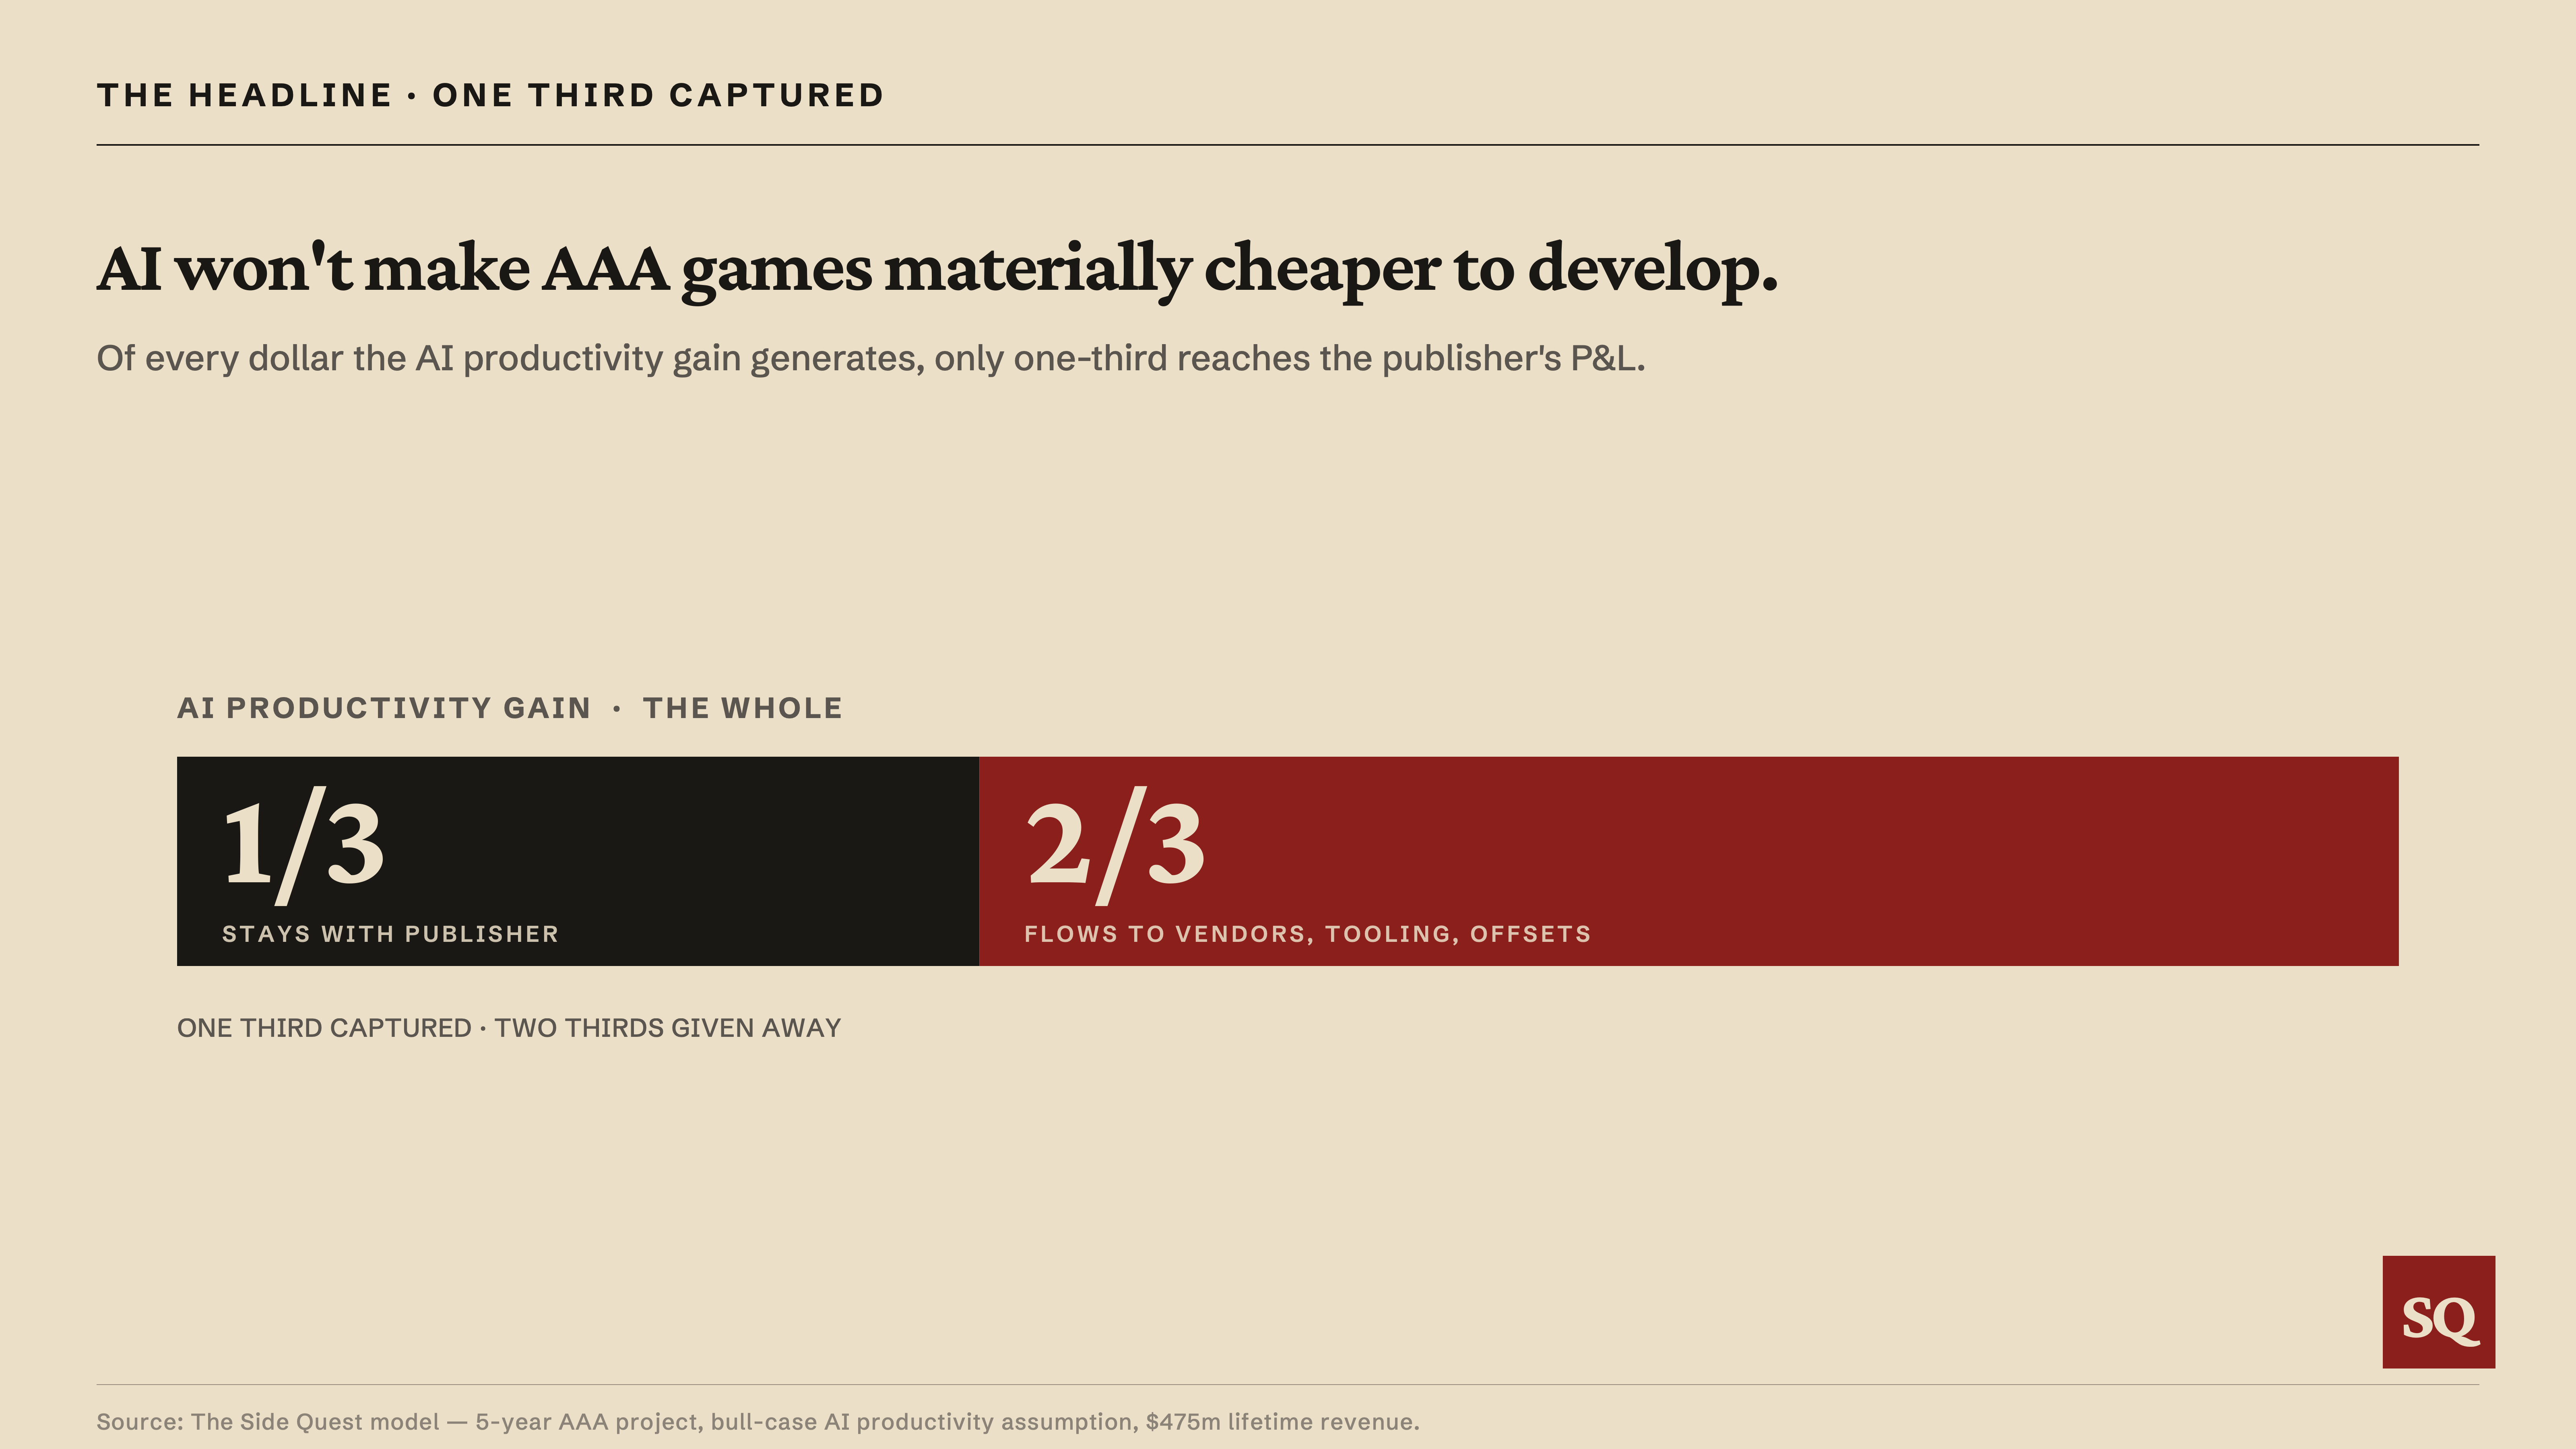
The major listed video games publishers are betting on AI to ease a cost crisis. The productivity gains are real, but most flow to AI tool vendors and cloud infrastructure providers. Publishers capture roughly one-third of the gross gain. The other two-thirds leaves the P&L before reaching the bottom line.
The five-year cost picture is closer to net neutral than to net savings. Year one is cost-additive on a P&L basis and worse still on free cash flow, as capex on on-prem infrastructure and AI tooling adoption costs front-load.
AI buys margin defence and pays for it on the same line. The realistic outcome is a three-point absolute lift in operating margin (22% to 25%), against the eight-point expansion the bull narrative implies from labour productivity alone. The missing five points are absorbed by AI tooling and internal adoption costs before reaching the publisher’s bottom line. Separately, AI offsets a little over half of the inflation that would otherwise have lifted the annual cost base by about $37m by 2030.
The full Excel model is available on request.
The industry’s bet
The major listed video games publishers are running out of ways to make the next AAA project work. AAA, the industry shorthand for the largest budgets and most ambitious productions, has seen costs swell from eight to nine figures over the last decade without a corresponding lift in unit sales. EA, Take-Two, CD Projekt Red, Ubisoft, and Embracer have all spent the past two years cutting headcount, cancelling projects, and closing studios. AI has been a recurring topic on each of their earnings calls this year.
Take-Two’s Strauss Zelnick, speaking at the Interactive Innovation Conference in Las Vegas last month, gave the canonical version of the industry’s answer when asked whether the trajectory is sustainable:
“It’s not really sustainable unless you make massive blockbusters. We certainly can’t deal with exponential growth, we probably can’t even deal with linear growth, in production costs.”
Asked whether AI was the only bet, Zelnick added: “No, but I mean, sort of, if you broaden it and you take out the word ‘AI’ and replace with the word ‘technology,’ which I prefer. I would argue it is our bet.”
The thesis here is that the bet does not pay off the way the bull narrative assumes. The productivity gains in specific functions are real and measurable. The technology works. The problem is where the productivity value goes. It does not stay with the publisher.
The bull case doesn’t consider the full picture
The model is built around a stylised example: a third-party AAA narrative title, US-based studio, Unreal Engine 5, five-year cycle running 2026-2030. The full anchoring is in the appendix.
The lifetime P&L bridges from a no-AI baseline through the bull narrative on AI productivity to the realistic with-AI position, with the offsets that absorb most of the gross gain shown explicitly:
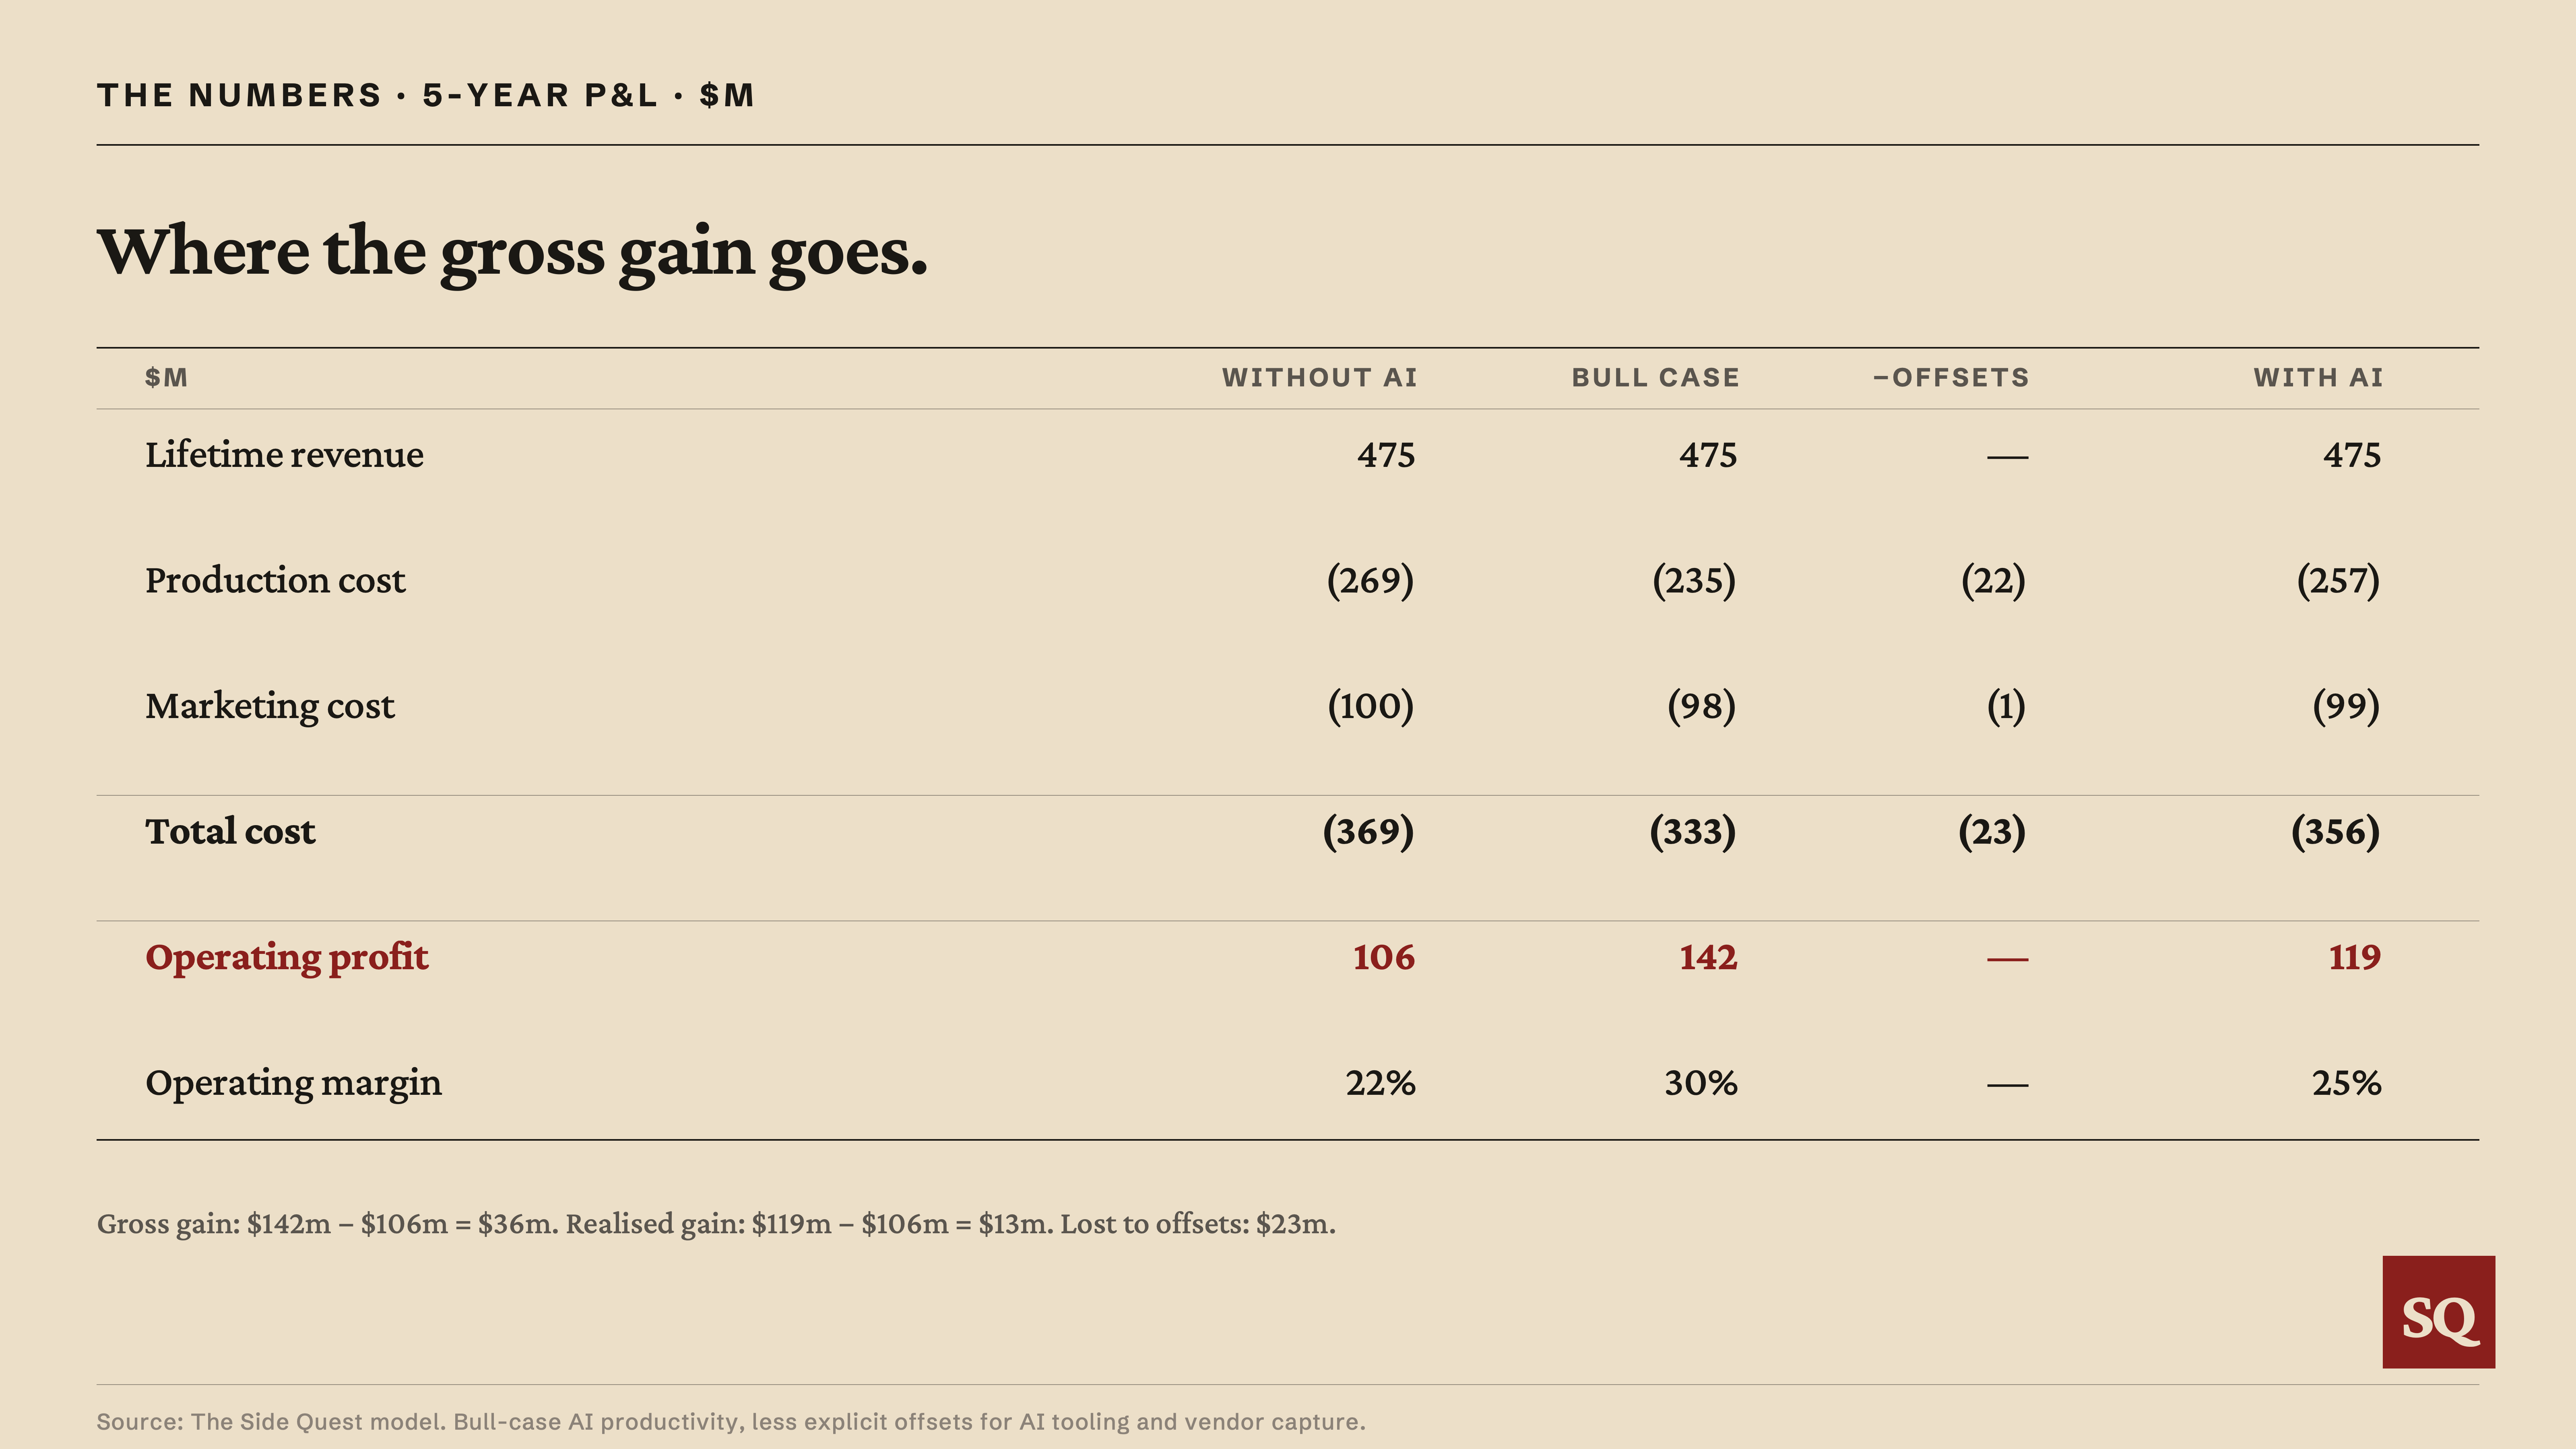
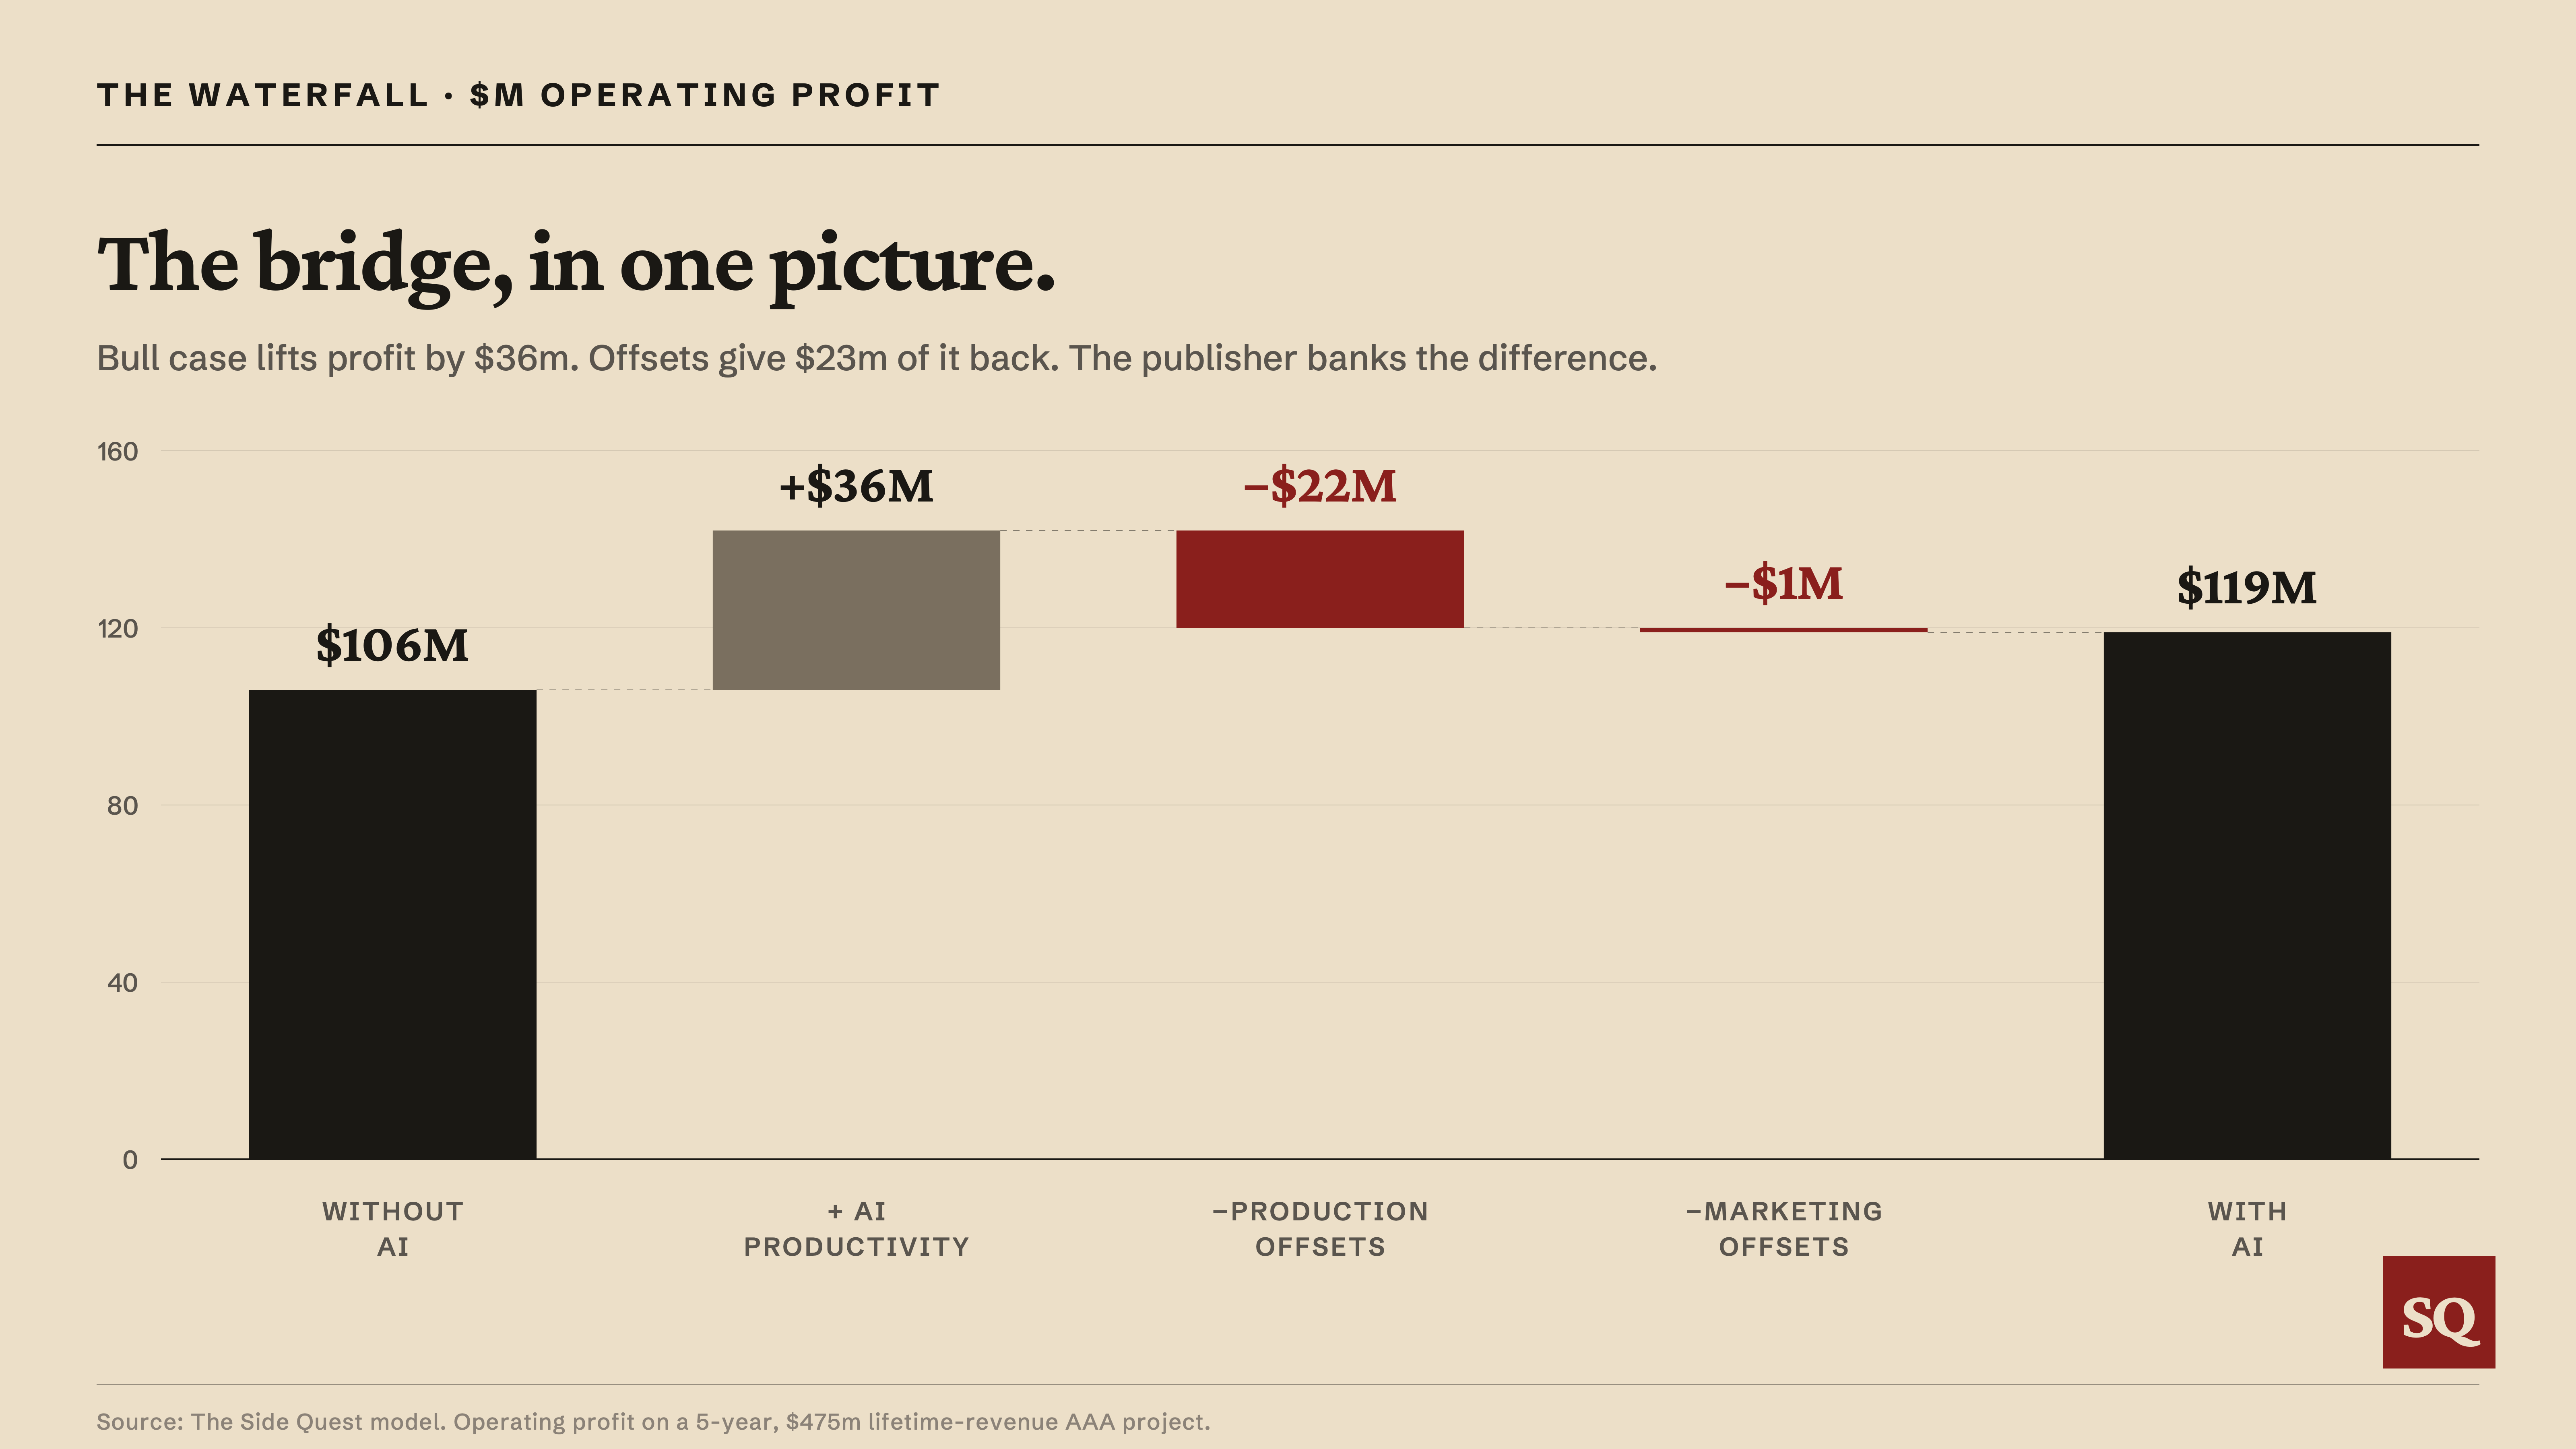
The bull case column shows what the P&L would look like if every dollar of gross AI productivity gain flowed straight through to operating profit. The gross labour compression runs to roughly $36m across the project, which lifts operating profit from $106m to $142m. This is the picture the bull narrative on AI in AAA captures.
The offsets column is where most of the gross gain leaves the publisher’s P&L. About $23m of cost gets added back. Operating profit drops from the $142m bull case to the realistic $119m position.
The math on what the publisher captures is straightforward:
Gross AI productivity gain (bull case): $142m − $106m = $36m
Realised AI gain (with AI): $119m − $106m = $13m
Lost to AI tooling, vendor capture, and offsets: $23m
Value creation flows to AI companies
The largest offset is direct, to AI tool vendors and cloud infrastructure providers. Per-developer subscriptions, cloud API consumption for non-subscription workloads, on-prem GPU infrastructure for sensitive code, and specialist tooling add up to roughly $12m across the project. AI tooling spend runs to roughly 5% of production cost. This is a line item that did not exist on the AAA P&L in 2020.
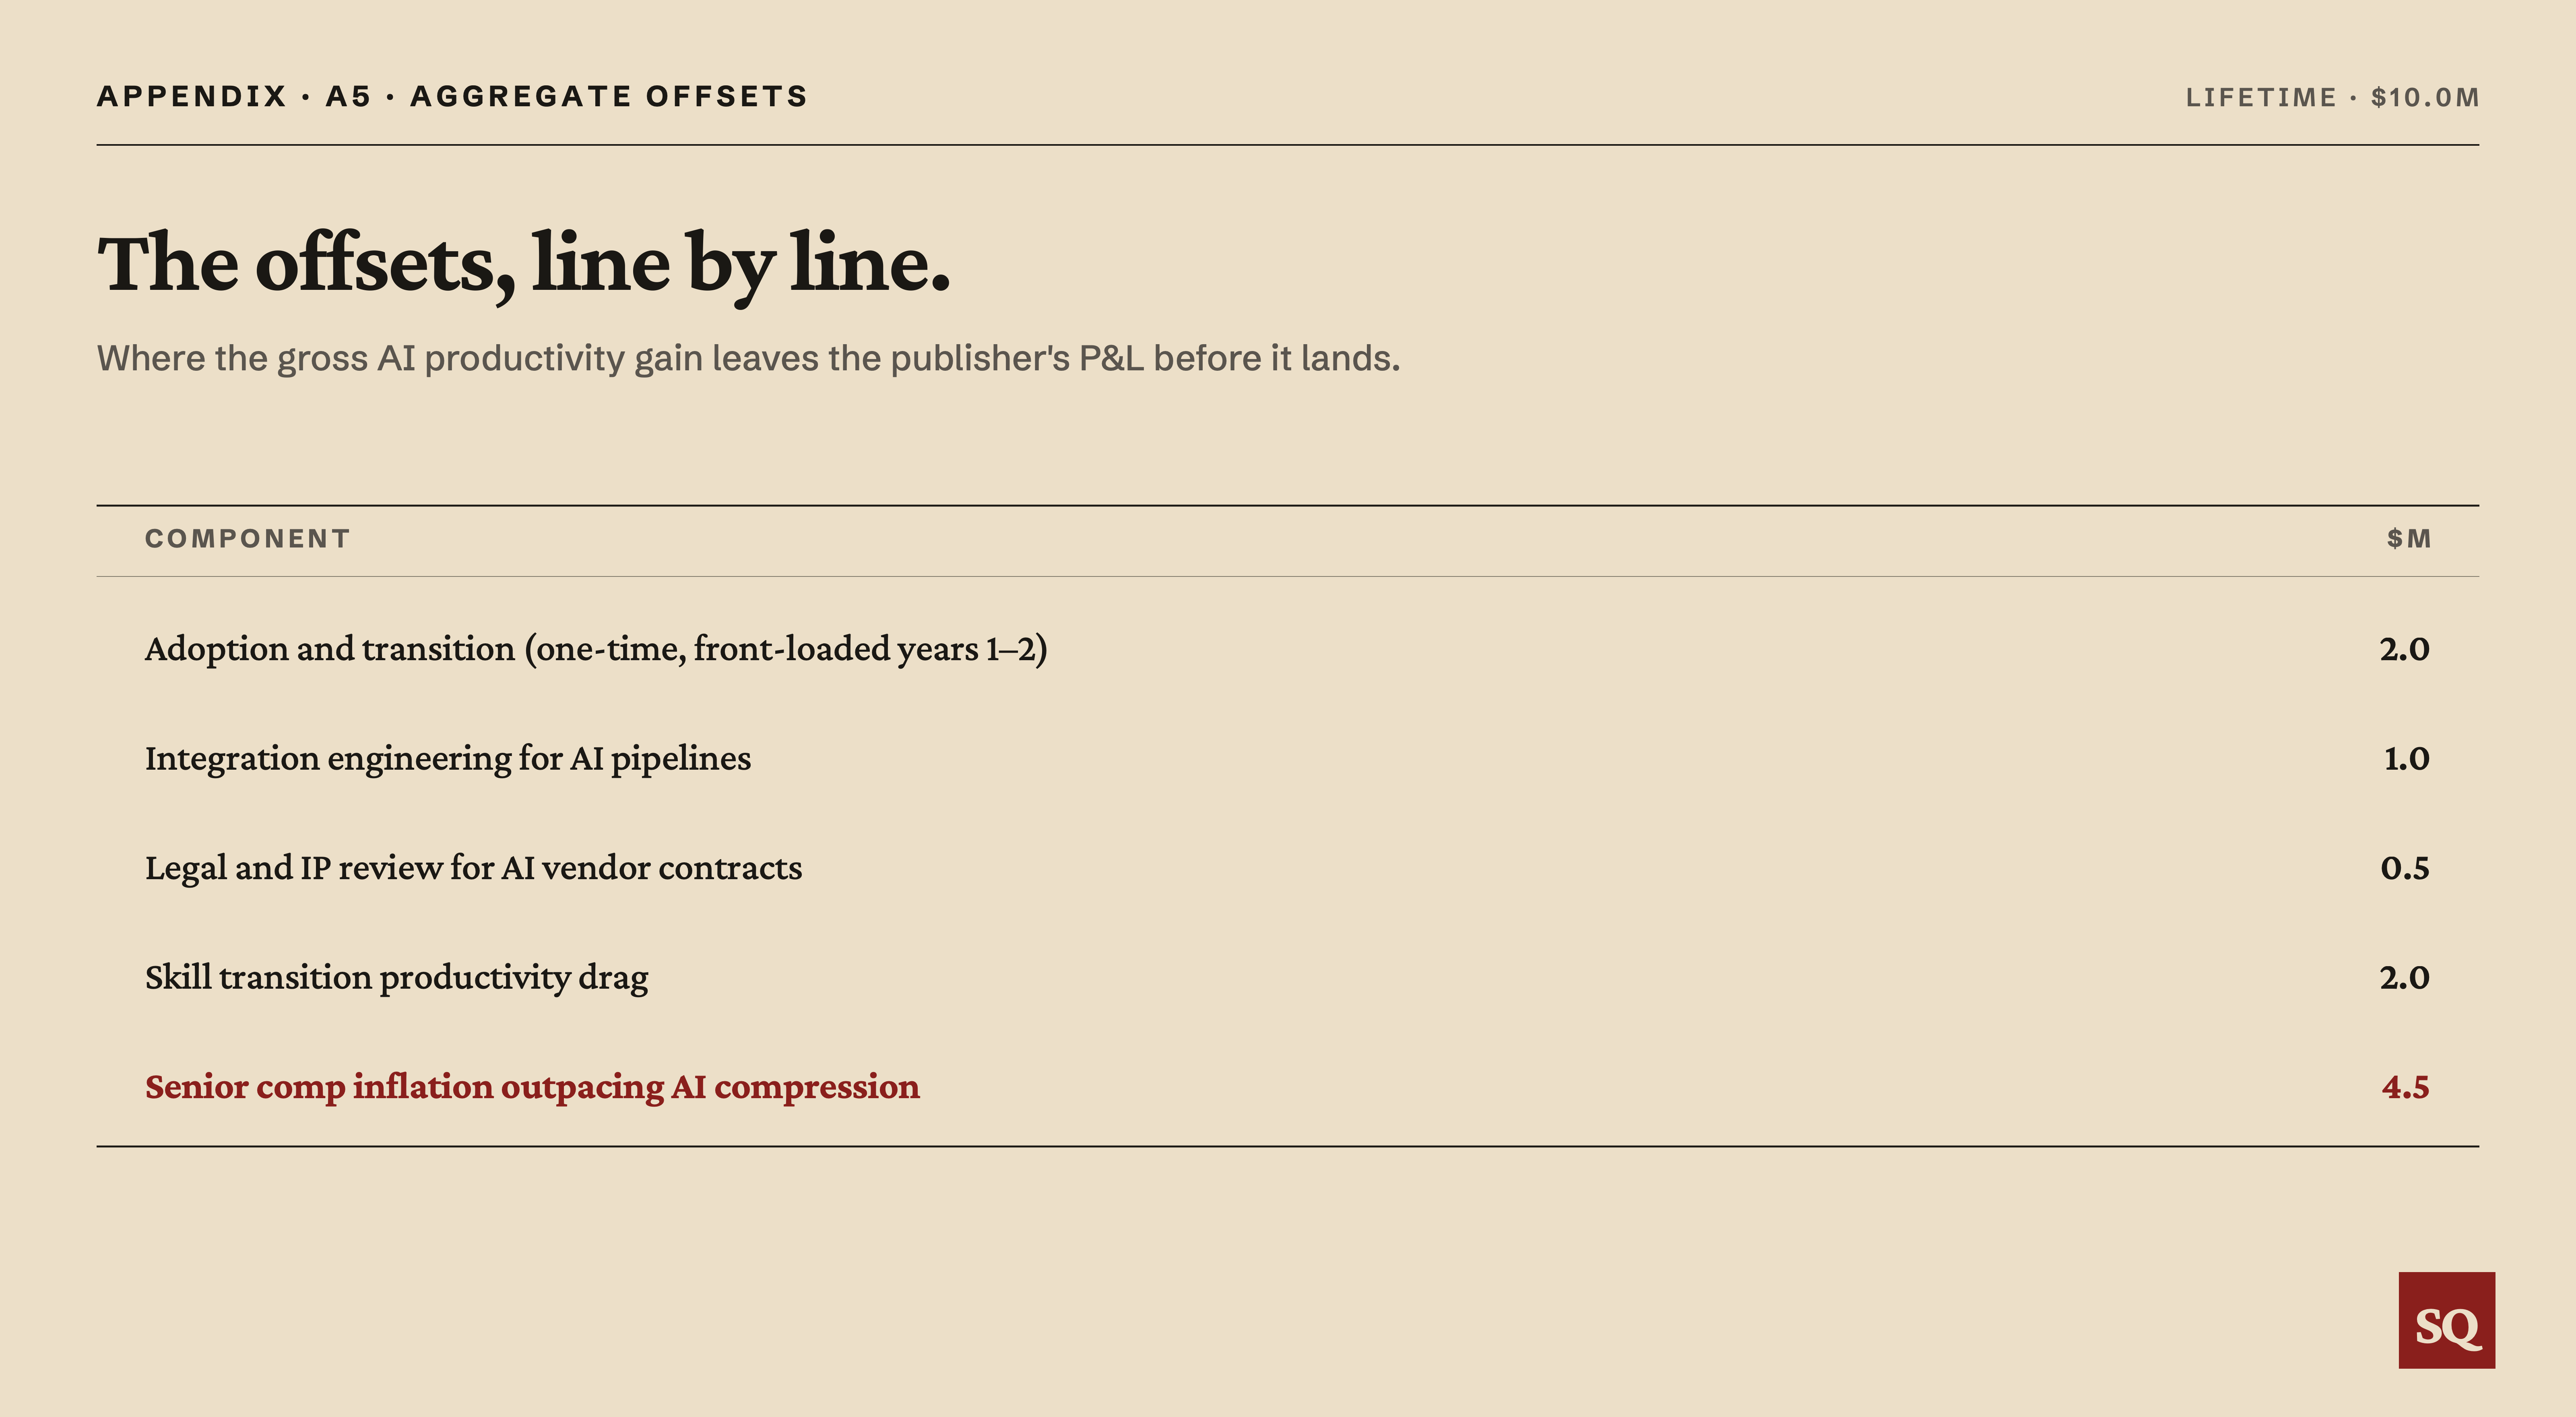
The second offset is adoption friction in the first two years of the project: tool selection, pipeline integration, legal and IP review of AI vendor contracts, and the productivity drag during the period when engineers are learning new tools rather than producing output. Roughly $5m across the project.
The third offset is senior comp inflation. AI-skilled engineers and creative leads are commanding meaningful premiums in 2025-2026 hiring data. The same labour AI is supposed to compress is the labour that gets more expensive at the senior end. Junior and mid-tier roles, where AI productivity gains are largest, are where displacement falls. The retained labour is the senior tier, where AI productivity gains are smallest and where pay pressure is highest. Roughly $5m across the project.
The companies whose P&Ls genuinely change shape because of AAA AI adoption are Anthropic, OpenAI, Microsoft, Cursor, and the specialist tooling vendors. Not the publishers. The bifurcation in vendor pricing models, between per-seat licensing (Copilot, Cursor) and consumption-based pricing (Anthropic API, AWS Bedrock, ElevenLabs usage credits), does not change the structural picture. Bundled or “free” tooling, where it appears, still extracts value through cloud compute and usage credits downstream. The mediator changes, but the value capture continues.
Costs will hit first before the benefit is realised
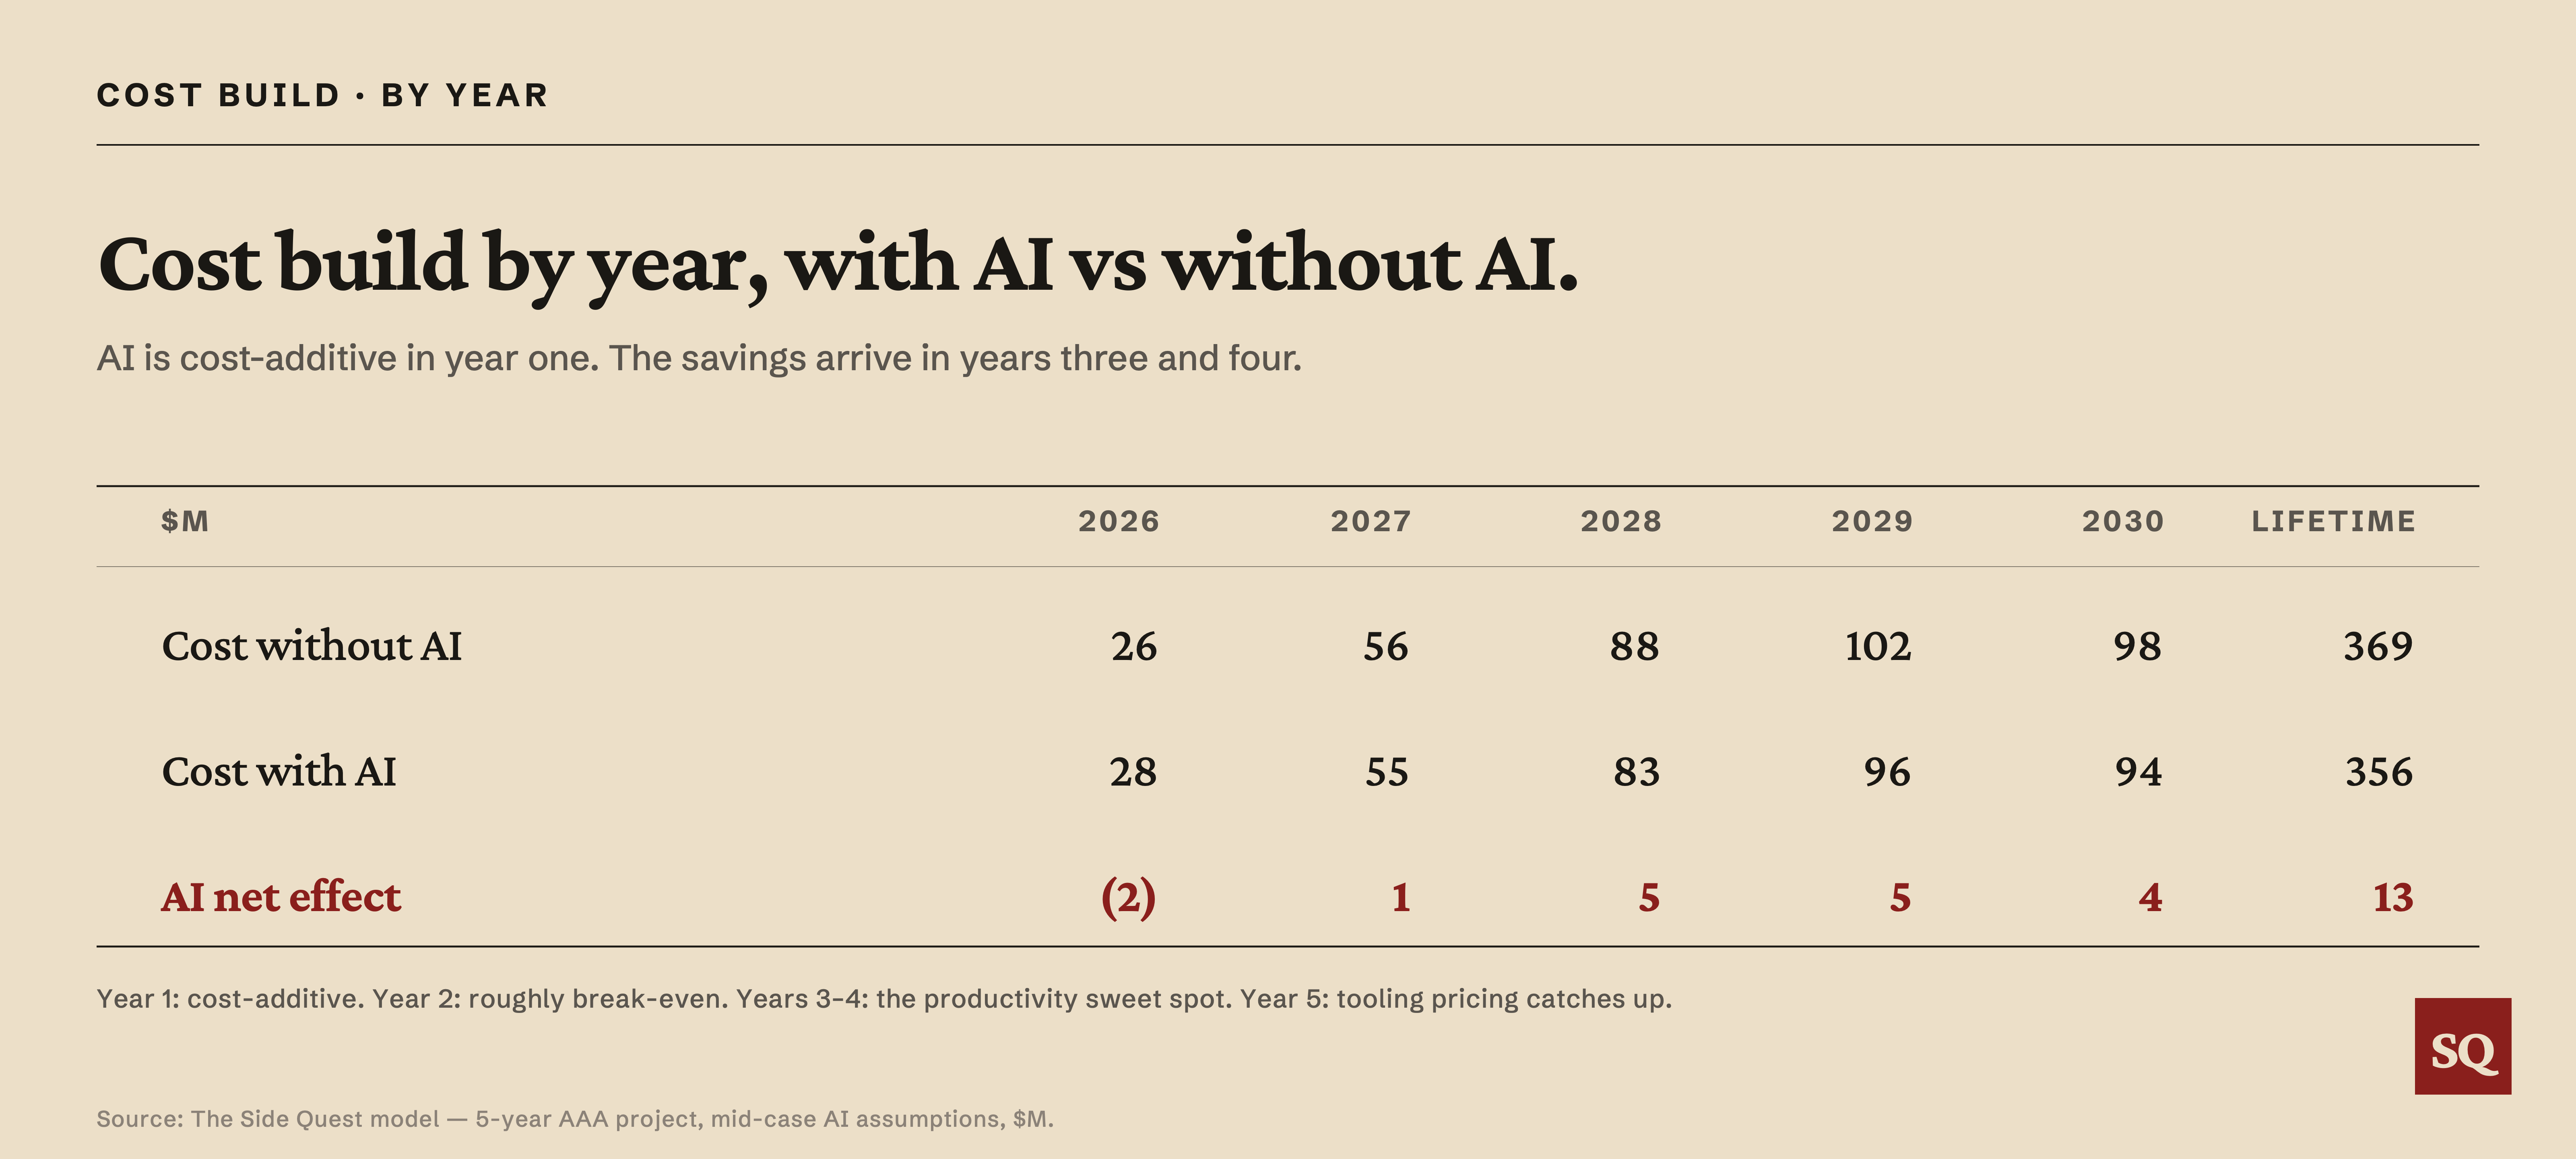
The lifetime decomposition flattens what the year-by-year breakdown shows: that AI is a net cost in the early years of the project before becoming a net saving in the middle.
The shape across the years:
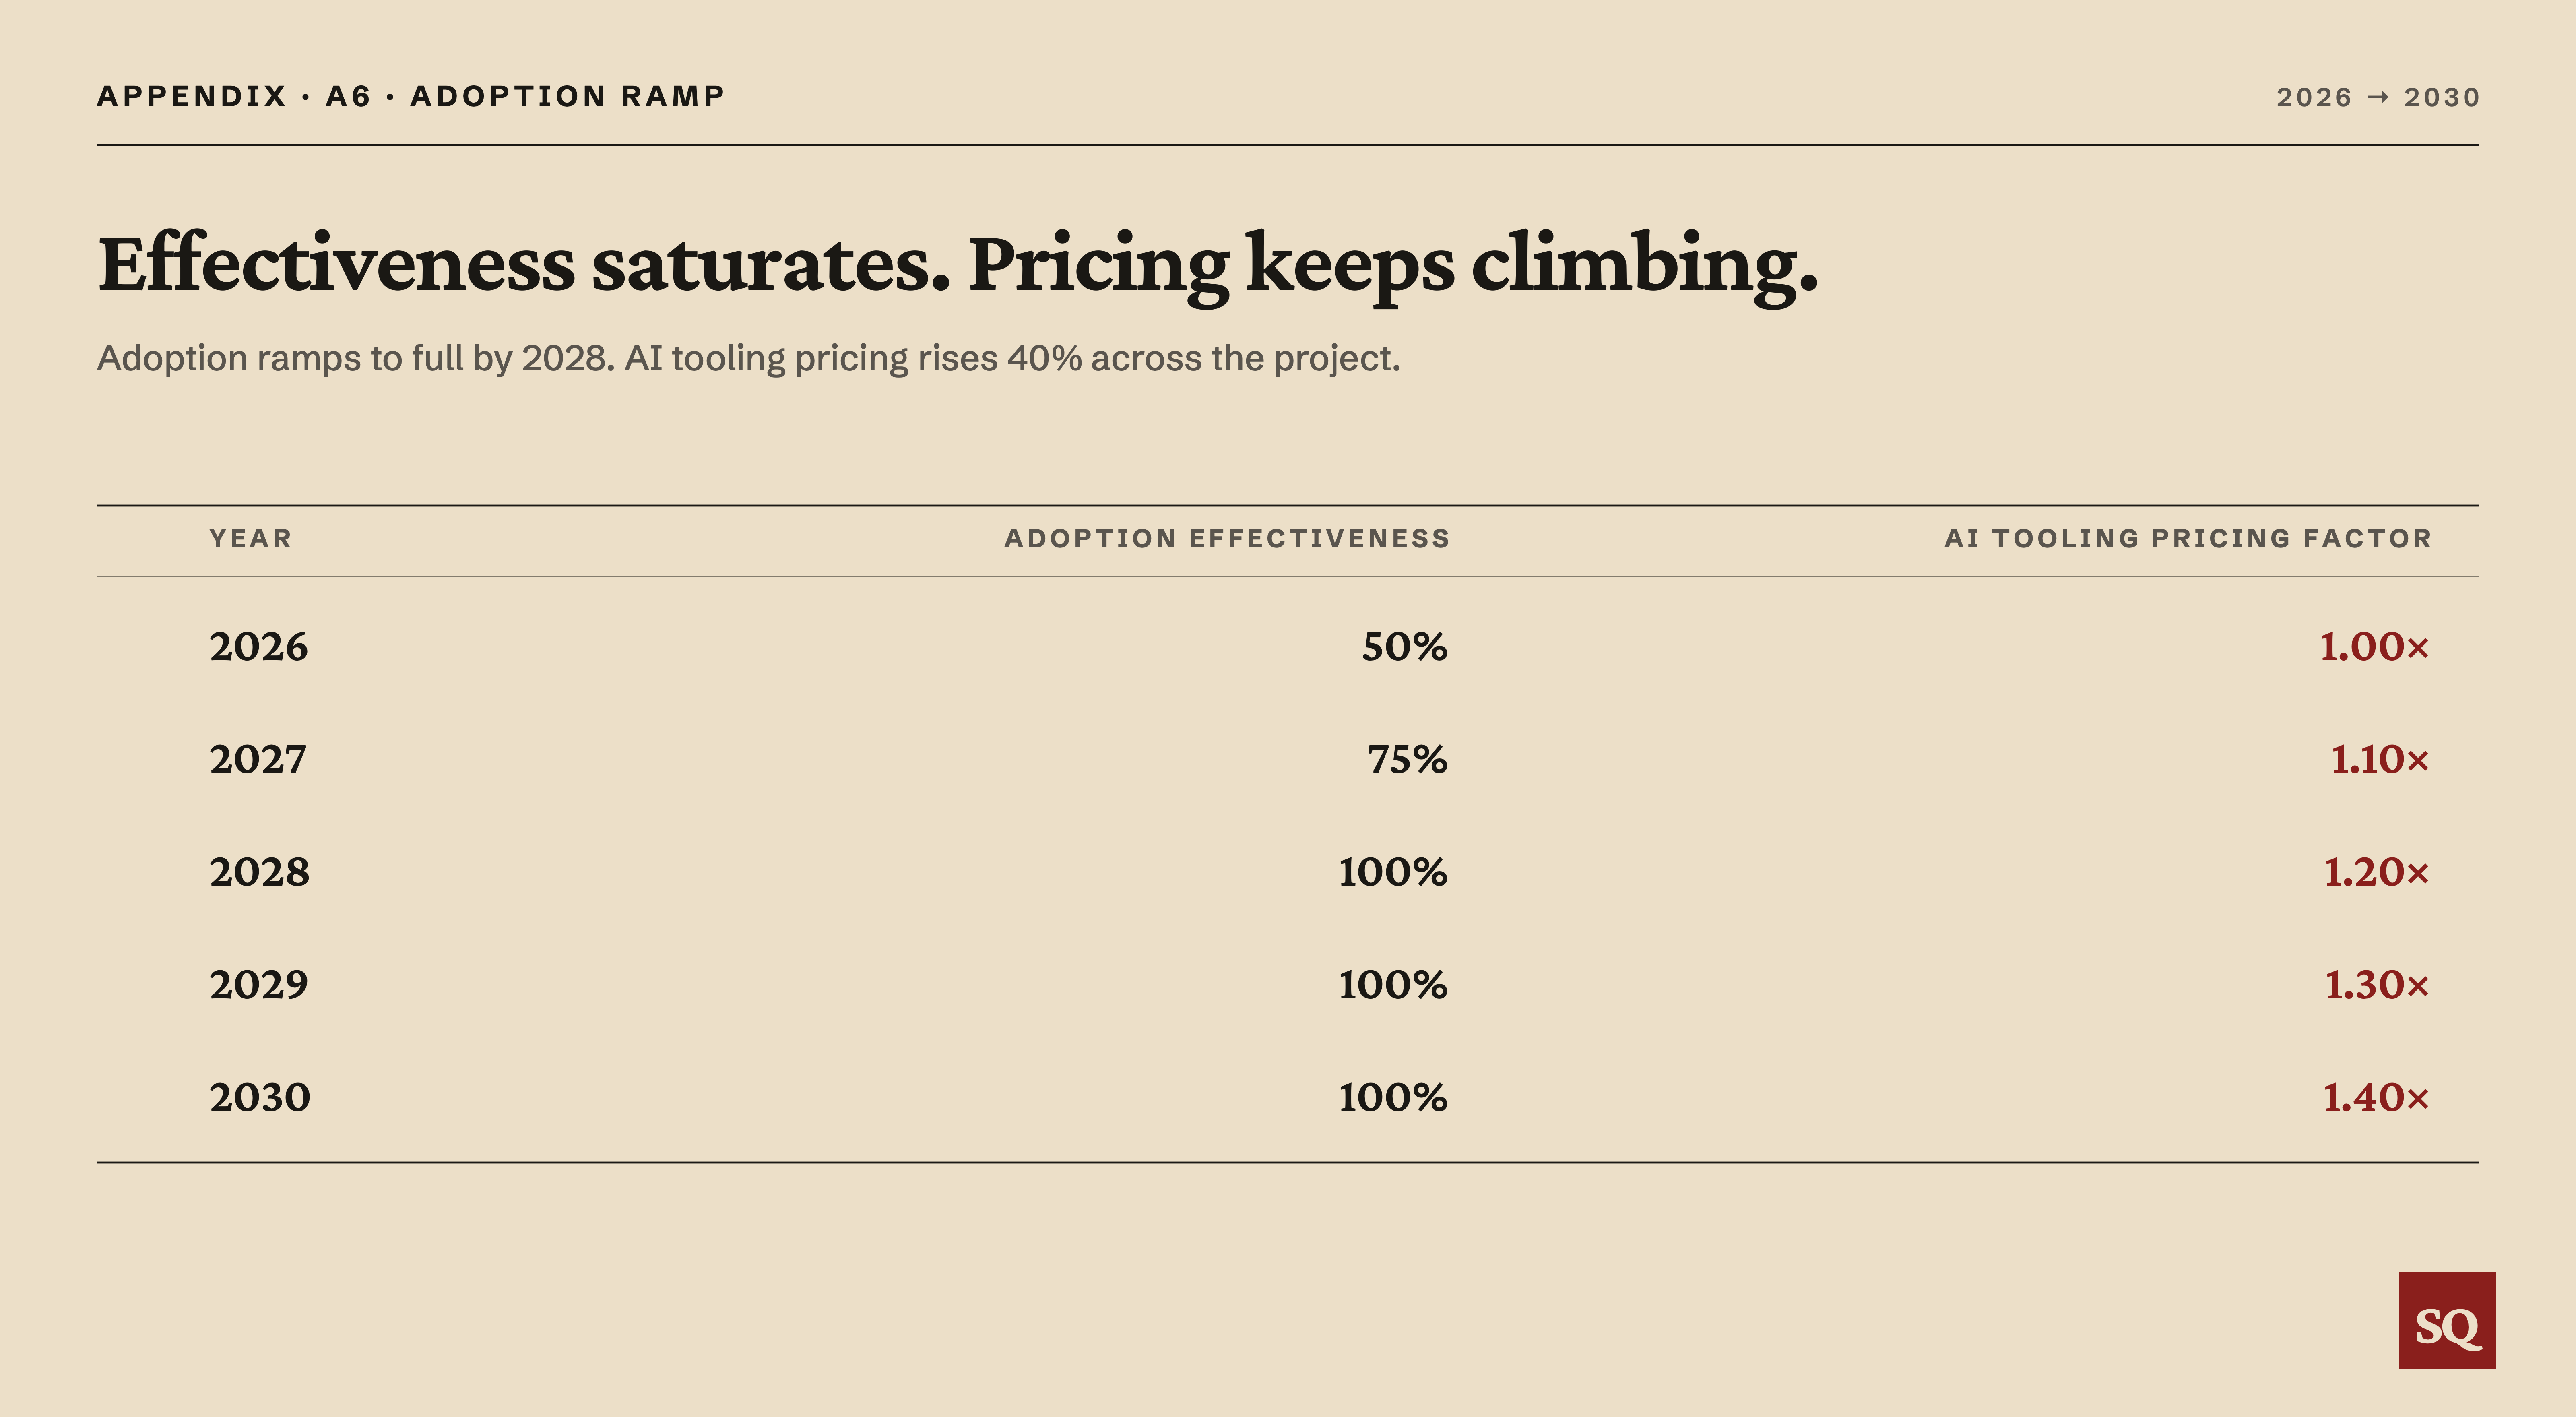
Year 1 (2026): Net cost-additive by $2m. Team is small. AI tools are at half-effectiveness because of integration friction. The studio is paying the heavy upfront costs of adoption. AI tooling spend front-loads while productivity gains ramp behind it.
Year 2 (2027): Roughly break-even. Productivity is at three-quarters effectiveness, but tooling costs have started to grow with first-round contract renewals at 15-20% above baseline.
Years 3-4 (2028-2029): The productivity sweet spot. Team is at peak headcount, adoption is mature, AI tools are delivering close to their full effectiveness. Most of the lifetime savings come from these two years.
Year 5 (2030): Compresses again as tooling costs grow another tier and the team shifts from production to finishing. Savings are still positive but smaller.
The cost profile across the project traces a J-curve: getting worse before it gets better. The J shape is the standard pattern for adoption-cost dynamics: front-loaded costs and slow benefits in the early years, payoff arriving later. For publishers running back-to-back AAA cycles, the implication is that the J-curve resets with each new project. The savings accumulated in the back end of one project are partly given back in the front end of the next, particularly when AI tooling pricing has continued to grow in the meantime.
The cash flow J-curve is sharper than the P&L J-curve
The P&L picture is the cleanest way to think about AI’s impact on the publisher, but it understates the cash flow drag in the early years of the project. Two things move on the balance sheet that don’t show up in the P&L view.
Working capital headwind. Working capital terms shift modestly. Outsourcer payables typically run around 43 days (anchored on Keywords Studios' disclosed FY2023 DSO prior to the EQT take-private). AI vendor spend is paid faster, on net 30 industry-standard terms across Anthropic, GitHub Copilot Enterprise, AWS Bedrock, Cursor, and Azure OpenAI invoiced services, and a portion (annual upfront cloud commitments, prepaid credits) sits as prepaid balance on the publisher's books. The net effect is a small permanent working capital drag of a few hundred thousand dollars by mid-project, smaller than the capex impact and not a material driver of the cash flow J-curve.
Capex on on-prem infrastructure. The $2.5m of self-hosted GPU infrastructure (needed for sensitive code that can't run on third-party cloud APIs) is genuine capex. Cash hits years 1-2 as the build-out completes; depreciation hits years 1-4 at roughly $0.6m per year on a 4-year schedule.
The combined cash flow picture. Layering the working capital change, capex, and depreciation add-back on top of the P&L produces this:
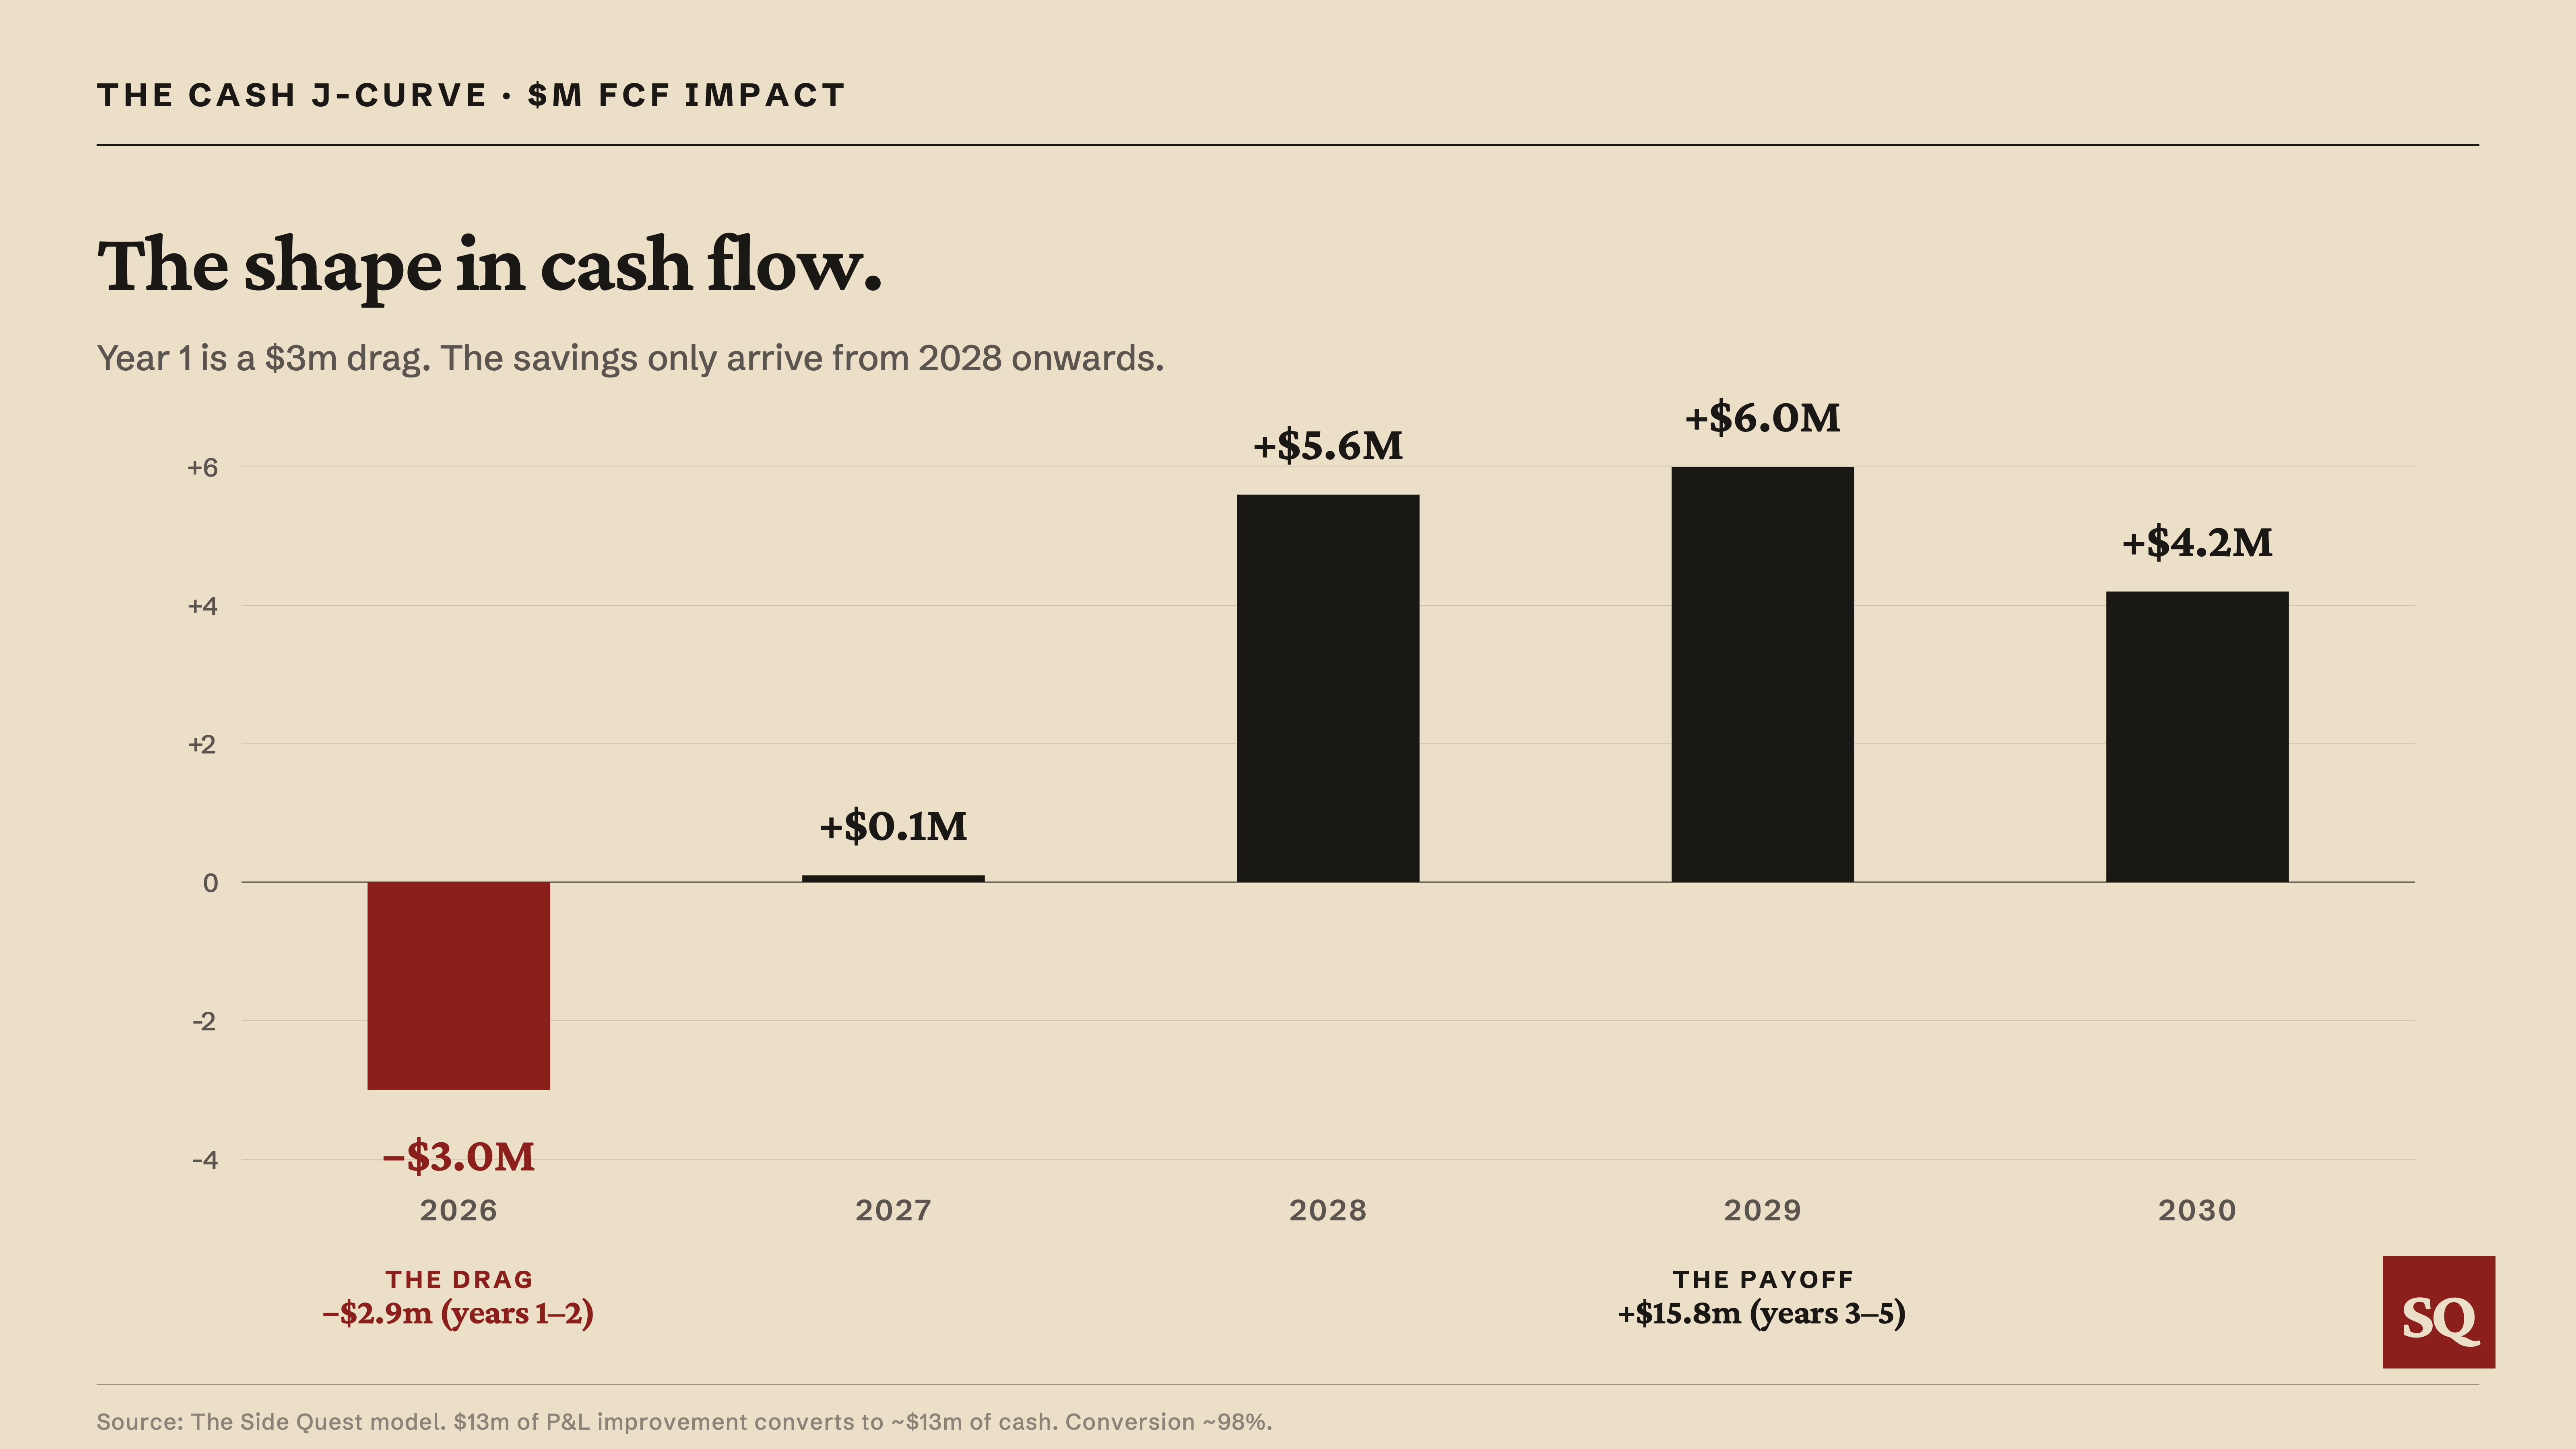
Over the full project, the AI net P&L improvement of $13m converts almost dollar-for-dollar to free cash flow. Lifetime FCF is roughly $13m, conversion close to 100%. The year-by-year texture is where the story is, and the dominant driver of the cash flow J-curve being sharper than the P&L J-curve is the front-loaded capex on on-prem GPU infrastructure, not the working capital shift.
Year one cash flow drag is $3m, roughly 50% bigger than the P&L drag of $2m. The capex hit on on-prem GPU infrastructure pulls cash forward outside of P&L recognition. Year two flips to roughly break-even on cash flow versus a modest P&L gain. Years three through five are when cash flow improvement actually arrives.
For investors looking at the AAA publishers’ cash flow statements through 2026-2028, the early-year drag from AI adoption will be visible if they know to look for it. Free cash flow will look worse than reported earnings during the build phase. This is the cash flow version of the treadmill we describe next.
Headcount: same finding in different units
The bull narrative often frames AI’s benefit as letting publishers ship the same game with fewer people, or the same scope with fewer staff-months. This is the same finding as the cost compression in different units. Expressed in labour rather than dollars, the $36m gross gain in the bull-case bridge above is equivalent to roughly 15-20% of internal direct labour over the cycle, on the order of 20-30 full-time equivalents.
The publisher’s choice is between cutting headcount to capture the saving, or holding headcount flat and reinvesting the released capacity as scope. The disclosed evidence so far suggests publishers cut headcount when forced to during 2023-2024, predominantly to unwind pandemic-era overhiring, and have held headcount roughly flat as AI has arrived, with content ambition rising to match. An alternative reading, increasingly common on earnings calls, is that AI is now being cited as the rationale for cuts that would have happened anyway. The model is agnostic on motive; what matters for the publisher P&L is the net result.
Either way, the answer for the publisher P&L is the same. Whether the released capacity becomes reduced cost (smaller team, same scope) or reinvested ambition (same team, bigger scope), the gross gain still gets absorbed by the AI tooling spend, the adoption friction, and the senior comp inflation captured in the offsets column. The publisher residual stays at $13m. AI’s structural effect on AAA studio headcount is the same as its structural effect on AAA studio cost: real, but mostly captured by AI vendors before it reaches the publisher.
AI is margin defence, with a thin slice of margin expansion
AI delivers two things to the AAA publisher: a modest absolute lift in operating profit, $106m to $119m on the lifetime project (three points of margin), and a partial defence against the salary inflation that would otherwise lift the annual cost base by roughly $37m by 2030. Both are real simultaneously. Neither flows to the publisher’s bottom line at the rate the bull narrative implies, because both are paid for in cash on the same line.
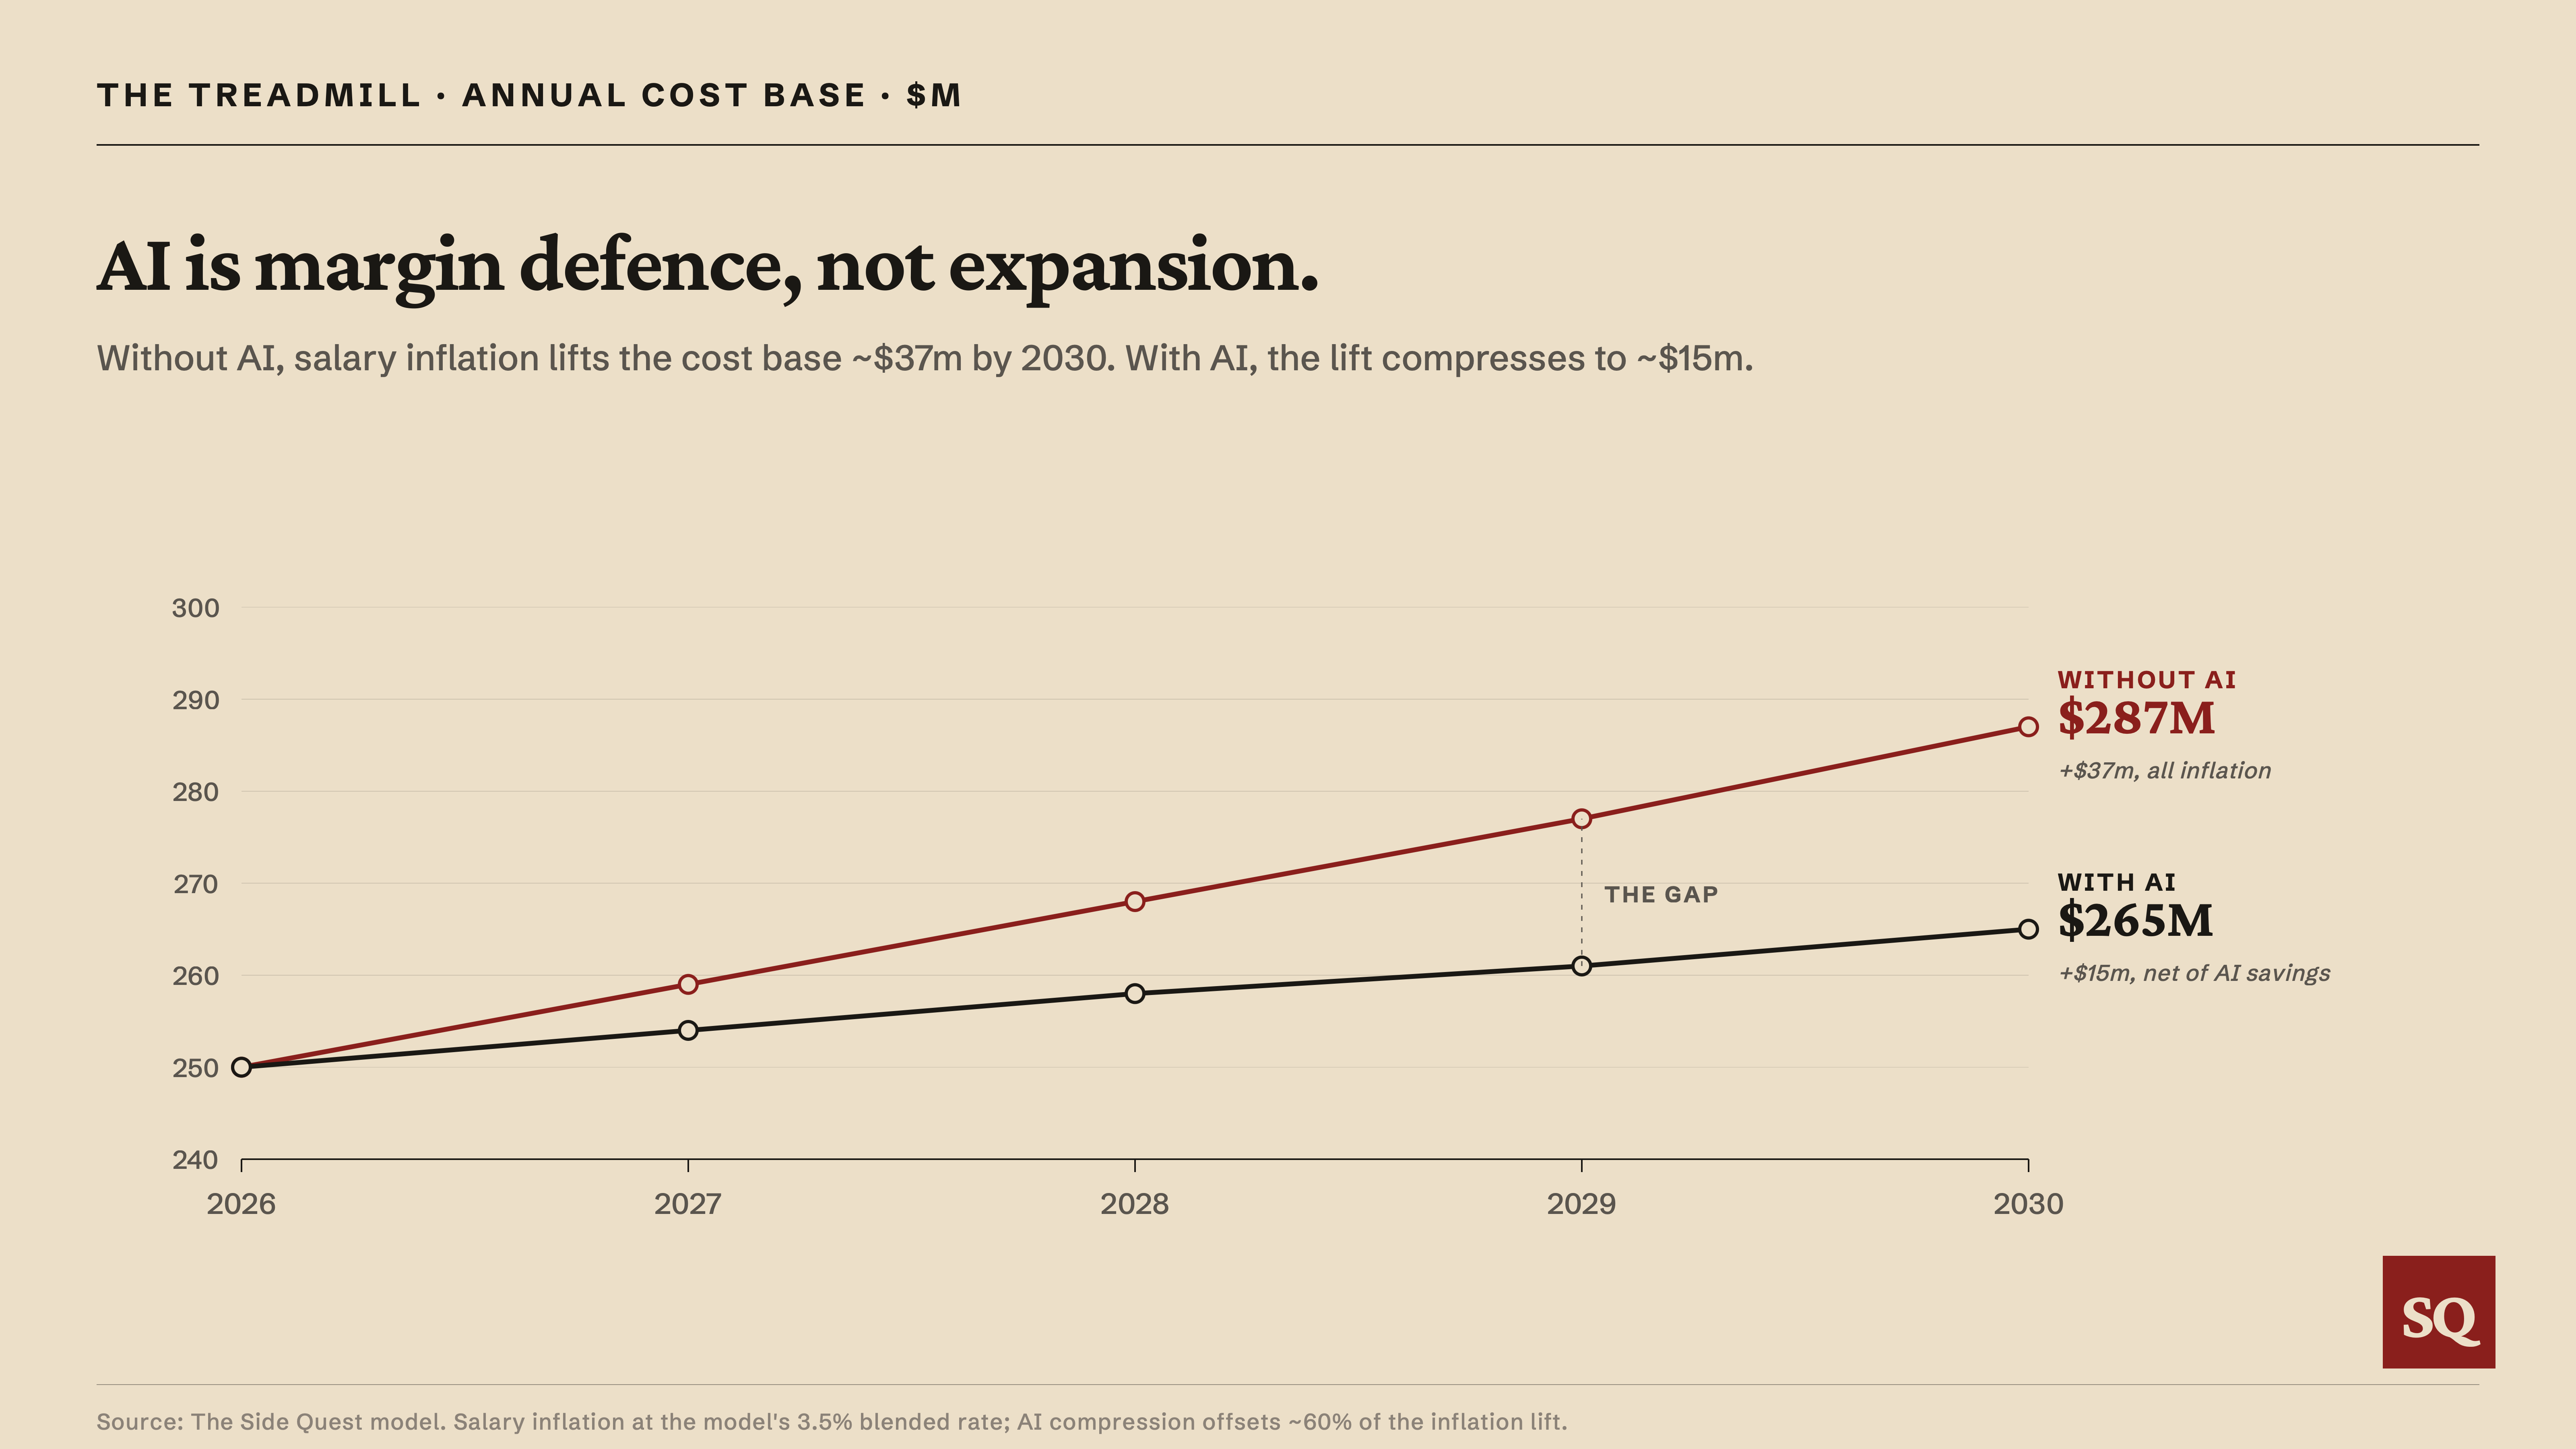
Without AI, salary inflation of 3-5% annually compounds against a labour-heavy cost base. Senior creative and engineering roles inflate faster than the general 3% rate. A studio running a $250m AAA programme in 2026 dollars would be running it at roughly $287m by 2030 on a run-rate basis, just from inflation, before any scope creep. With AI compression layered on top, that cost base runs at about $265m by 2030 instead. AI absorbs roughly 60% of the inflation lift that would otherwise have arrived. (This is the annual run-rate cost base; the inflation impact inside the five-year project model is smaller, because spend is weighted by the development ramp rather than spread flat across all five years.)
This is the treadmill. Publishers who adopt AI keep their cost base running close to flat in real terms. Publishers who don’t adopt watch inflation compound unchecked and end the cycle structurally more expensive than their AI-adopting competitors. The competitive dynamic forces adoption regardless of whether any individual publisher captures meaningful margin benefit, because the cost of not adopting is a structural margin disadvantage versus the rest of the industry.
The defence and the absolute lift are the two real benefits. The cost of both shows up on the same cost line that they are meant to protect. The $12m of AI tooling and $10m of non-tooling offsets are not a separate budget; they sit inside the operating cost base that the productivity gain is meant to reduce. The publisher buys defence against inflation and absolute productivity in the same transaction, and pays for both in cash to AI vendors and to internal adoption.
The bull narrative on AI in AAA implies operating margin expansion closer to eight percentage points (22% to 30%) on the gross labour compression alone. The realistic outcome in the model is three points of absolute expansion (22% to 25%) plus prevention of compression that would otherwise have arrived. The missing five points, between the bull narrative and the realised lift, show up as cost increases on the publisher’s P&L: roughly two and a half points to AI tool vendors and cloud infrastructure providers, and roughly two points to internal transition and adoption costs.
When AAA earnings calls in 2027 and 2028 credit AI for stable margins, the structural reality being described is paid-for stability. That is a real benefit, but it is structurally different from the bull narrative of AI driving margin expansion.
What this means for the AI question on earnings calls
The AAA publishers have run out of other levers. The cost of making the largest games has continued to rise faster than unit sales. AI is the productivity input with the largest claimed gains that hasn’t reached steady-state adoption. The competitive dynamic forces participation regardless of whether any individual publisher captures a meaningful share of the gain.
The model suggests that share is small. Publishers are buying AI tooling at growing enterprise pricing, absorbing real adoption costs, and capturing 36% of the gross productivity gain. Two-thirds flows to upstream technology providers. The result is that publishers spend money on AI tools to maintain parity with each other while transferring wealth to AI vendors.
For the AI question on earnings calls, the question worth asking is what specifically is being claimed. The bull narrative on AI in AAA implies margin expansion, on the assumption that gross labour compression flows straight to the operating line. The model suggests two to three points is the realistic absolute lift. The bull narrative conflates the gross labour compression with the net margin lift. The other five points are real productivity gain, but they flow to AI vendors and are absorbed by internal adoption costs before reaching the publisher’s bottom line. The same applies to free cash flow: the AI net P&L improvement converts almost dollar-for-dollar to cash over the lifetime, but the early-year texture is shaped by capex front-loading on on-prem GPU infrastructure rather than by a permanent cash conversion gap.
The companies making structurally new revenue from AAA AI adoption are not the AAA publishers. They are the AI tool vendors and the cloud infrastructure providers. The publishers pay for the tools. The residual they capture is real. It is also small.
Appendix
A1. The example title
A stylised third-party AAA narrative title, US-based studio, Unreal Engine 5, with the following central case:
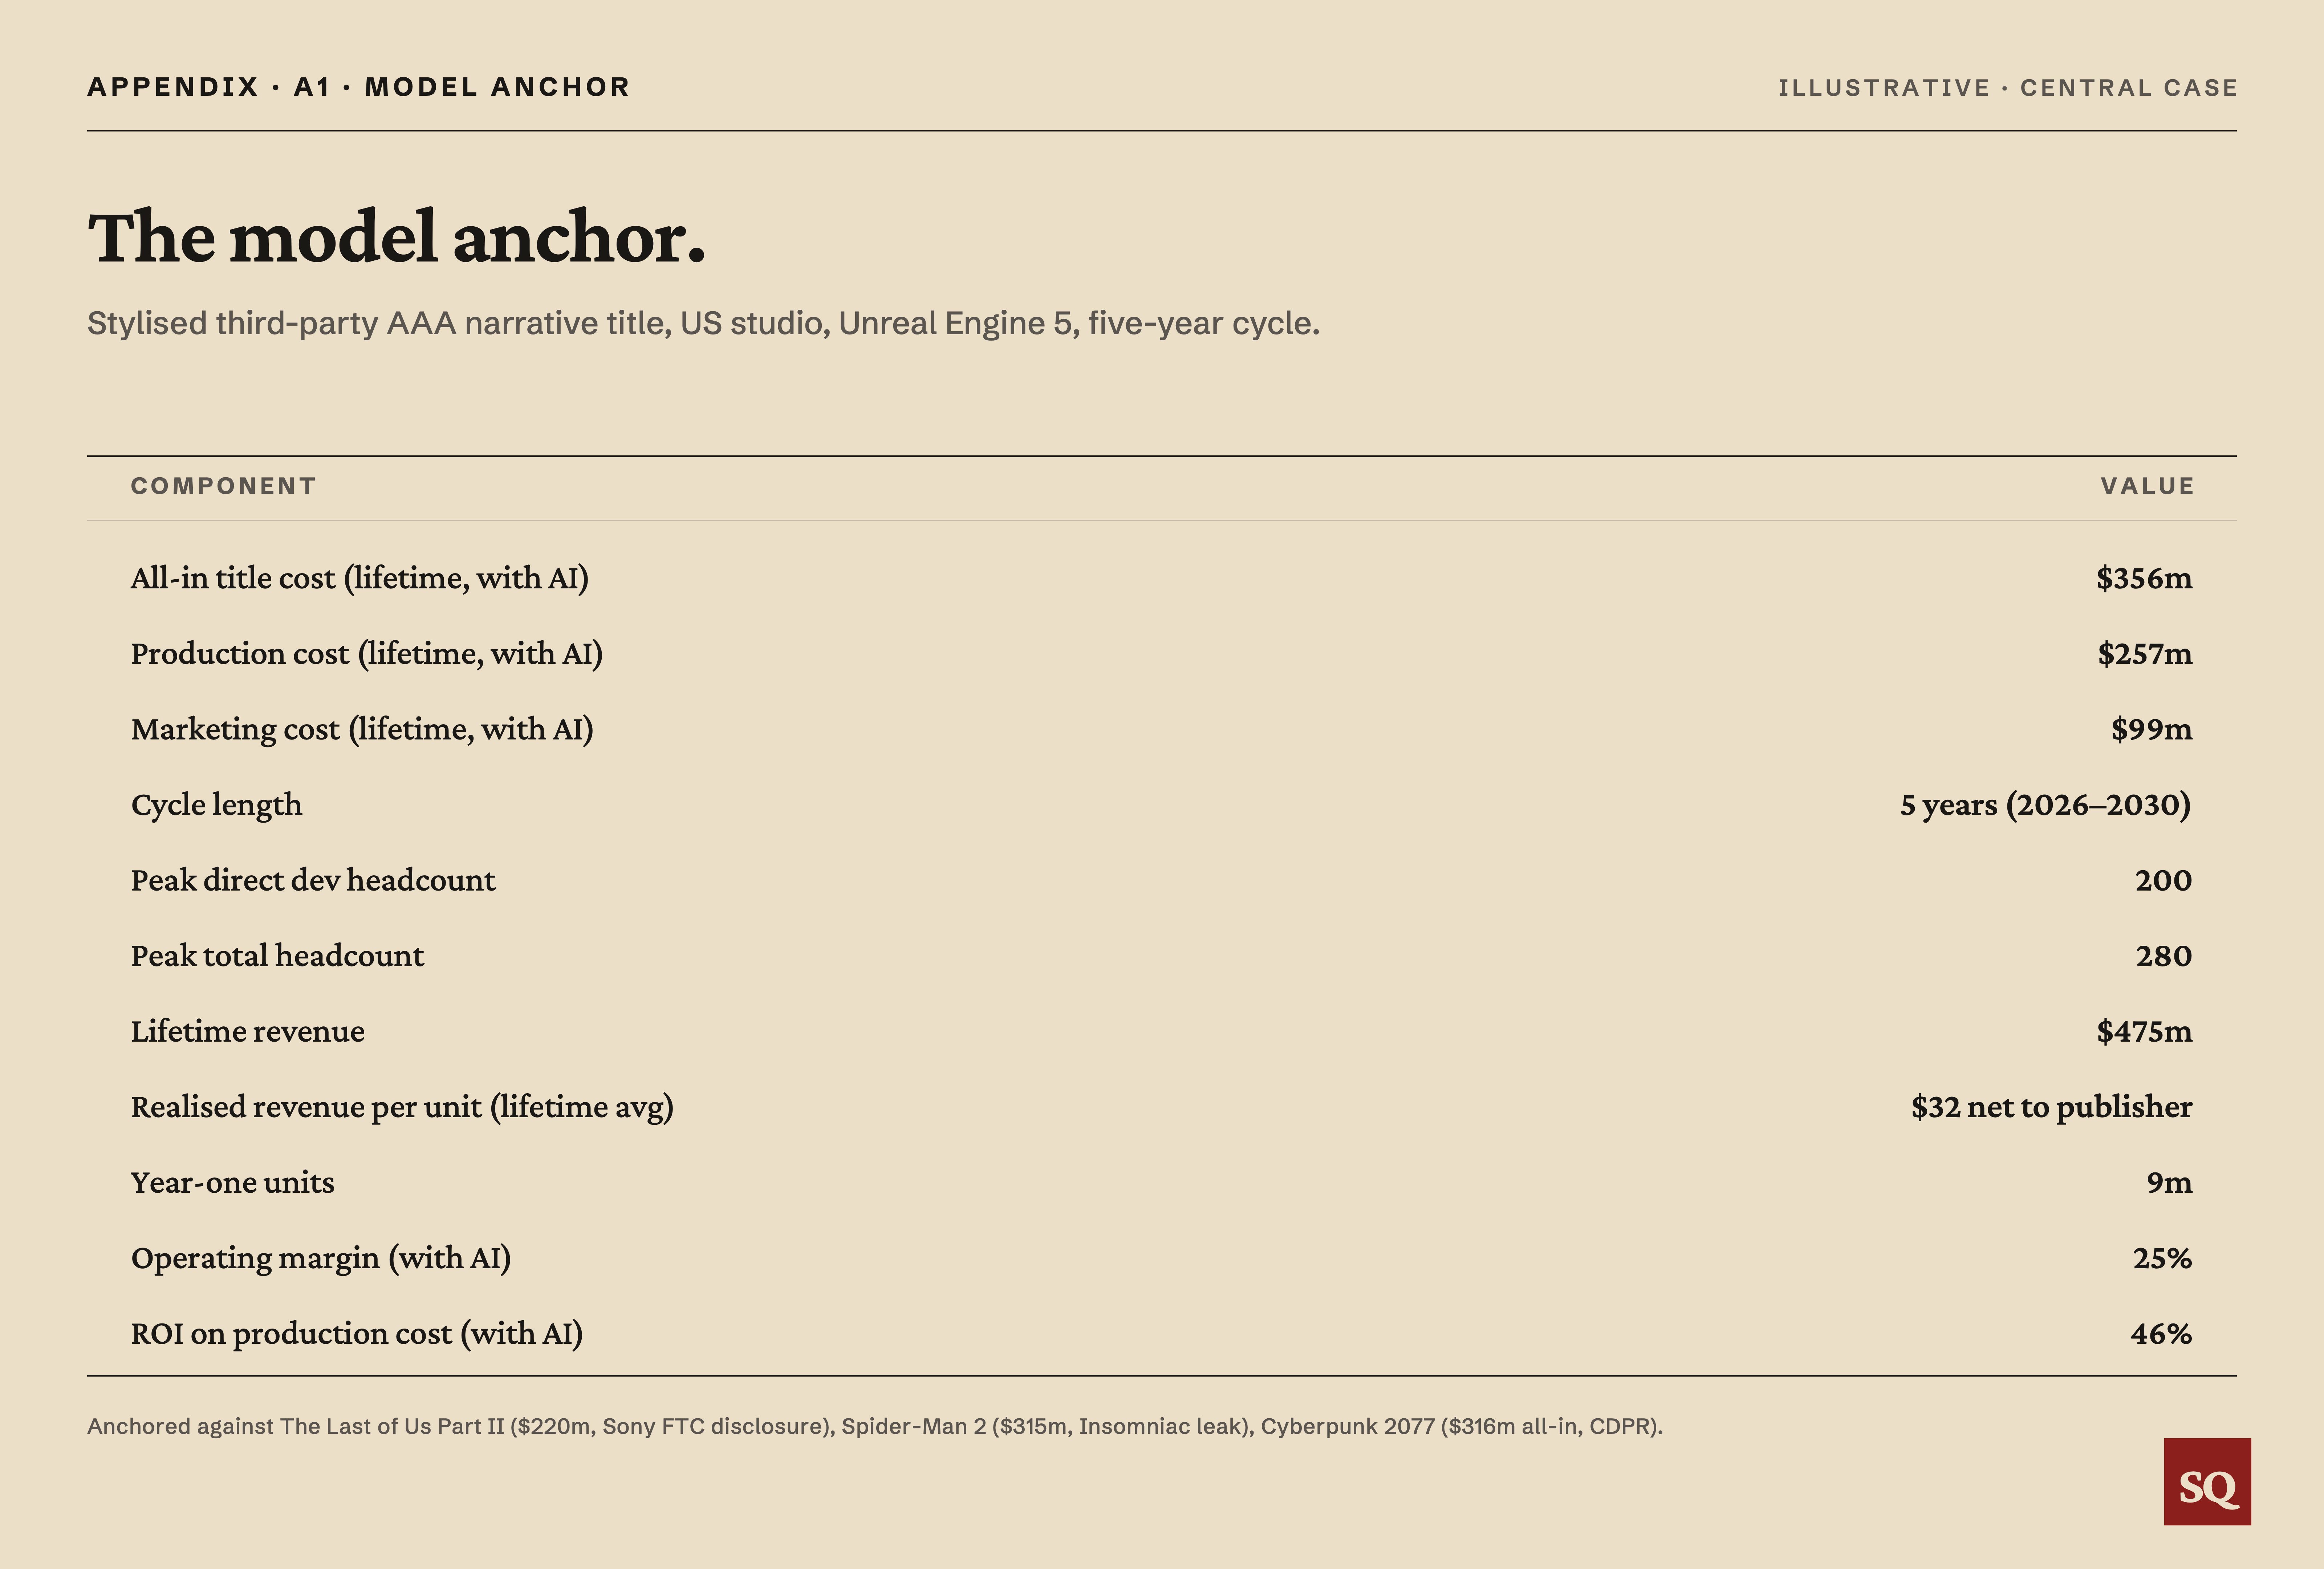
Component Value All-in title cost (lifetime, with AI) $356m Production cost (lifetime, with AI) $257m Marketing cost (lifetime, with AI) $99m Cycle length 5 years (2026-2030) Peak direct dev headcount 200 Peak total headcount 280 Lifetime revenue $475m Realised revenue per unit (lifetime average) $32 net to publisher Year-one units 9m Operating margin (with AI) 25% ROI on production cost (with AI) 46%
Anchored against three disclosed reference cases. The Last of Us Part II cost Sony $220m to develop over six years with a peak of about 200 staff (Sony FTC accidental disclosure, June 2023). Spider-Man 2 cost $315m all-in over five years with peak headcount of 264 developers and 116 support staff for 380 total (Insomniac ransomware leak, December 2023). Cyberpunk 2077 cost CD Projekt Red $174m development plus $142m marketing for $316m all-in at launch (CDPR investor disclosure).
For a third-party AAA, costs sit between Sony first-party economics (which avoid 30% platform fees on PSN sales and benefit from cross-promotion) and CDPR’s disclosed figures (which understate true cost by roughly 25-50% due to capitalisation choices under IAS 38). Insomniac’s internal model projected 35% ROI on the $215m production-cost base (excluding the c$100m of marketing), implying roughly $75m of profit on the $390m projected lifetime revenue. That works out to a 19% margin on revenue, comparable to the example title’s 22% baseline.
The model is also cost-side only and excludes cycle-time compression. In principle AI could raise throughput by shortening development cycles, but the time required to learn the tools, rebuild pipelines around them, and validate output offsets much of the nominal time saved during the adoption period, and there is no clean evidence yet of an AAA cycle compressed and attributed to AI. Throughput is a separate question from the cost compression modelled here.
This archetype is a third-party publisher on a licensed engine, buying AI tooling rather than building it. First-party publishers (Sony, Microsoft) capture more of the same productivity gain because they avoid the 30% platform fee; engine owners (EA’s Frostbite, Ubisoft’s Snowdrop/Anvil) can amortise AI integration across multiple studios. The 36% capture rate is specific to the third-party, tooling-buyer case.
A2. Sources for productivity claims
Engineering compression (10-15%) anchored on: Cui, Demirer, Jaffe, Musolff, Peng & Salz (2025), three randomised field experiments at Microsoft, Accenture and an anonymous Fortune 100 company covering ~4,900 developers, which found a ~26% increase in completed tasks among developers given GitHub Copilot, with the largest gains accruing to less-experienced developers. Discounted heavily for AAA-specific friction: proprietary-engine work, performance-critical code, console-memory budgets and NDA constraints are less tractable for current models than the cloud and enterprise code in that sample.
QA compression (15-25% internal, 25-35% external) anchored on: Nunu.ai Stormforge case study at 30% on a single workflow, discounted for non-AI automation already absorbed.
Senior comp inflation (8-12% premium for AI-skilled roles) anchored on: 2025-2026 hiring data from Levels.fyi, Ravio, and Aeqium tech-industry compensation reports.
Layoff baseline anchored on: 11% of game developers laid off in 2024, with two-thirds of AAA respondents reporting layoffs at their company, per GDC State of the Industry 2025 and 2026 reports.
AI tooling pricing anchored on: Anthropic's published Claude Code enterprise pricing ($150-250 per developer per month); Cursor pricing from $20/month Pro to $200/month Ultra, with enterprise heavy-user spend layering frontier-model usage on top; GitHub Copilot Business ($19/seat) and Enterprise ($39/seat) per month; enterprise SaaS pricing benchmarks from Vendr.
Working capital and DPO anchors: Working capital and DPO anchors: Keywords Studios’ disclosed days sales outstanding of 42 days (FY2023 annual report, last public disclosure before the EQT take-private in 2024); Anthropic API prepaid-credits model; enterprise SaaS pricing patterns generally.
A3. Compression rates by function
A4. AI tooling and infrastructure cost build
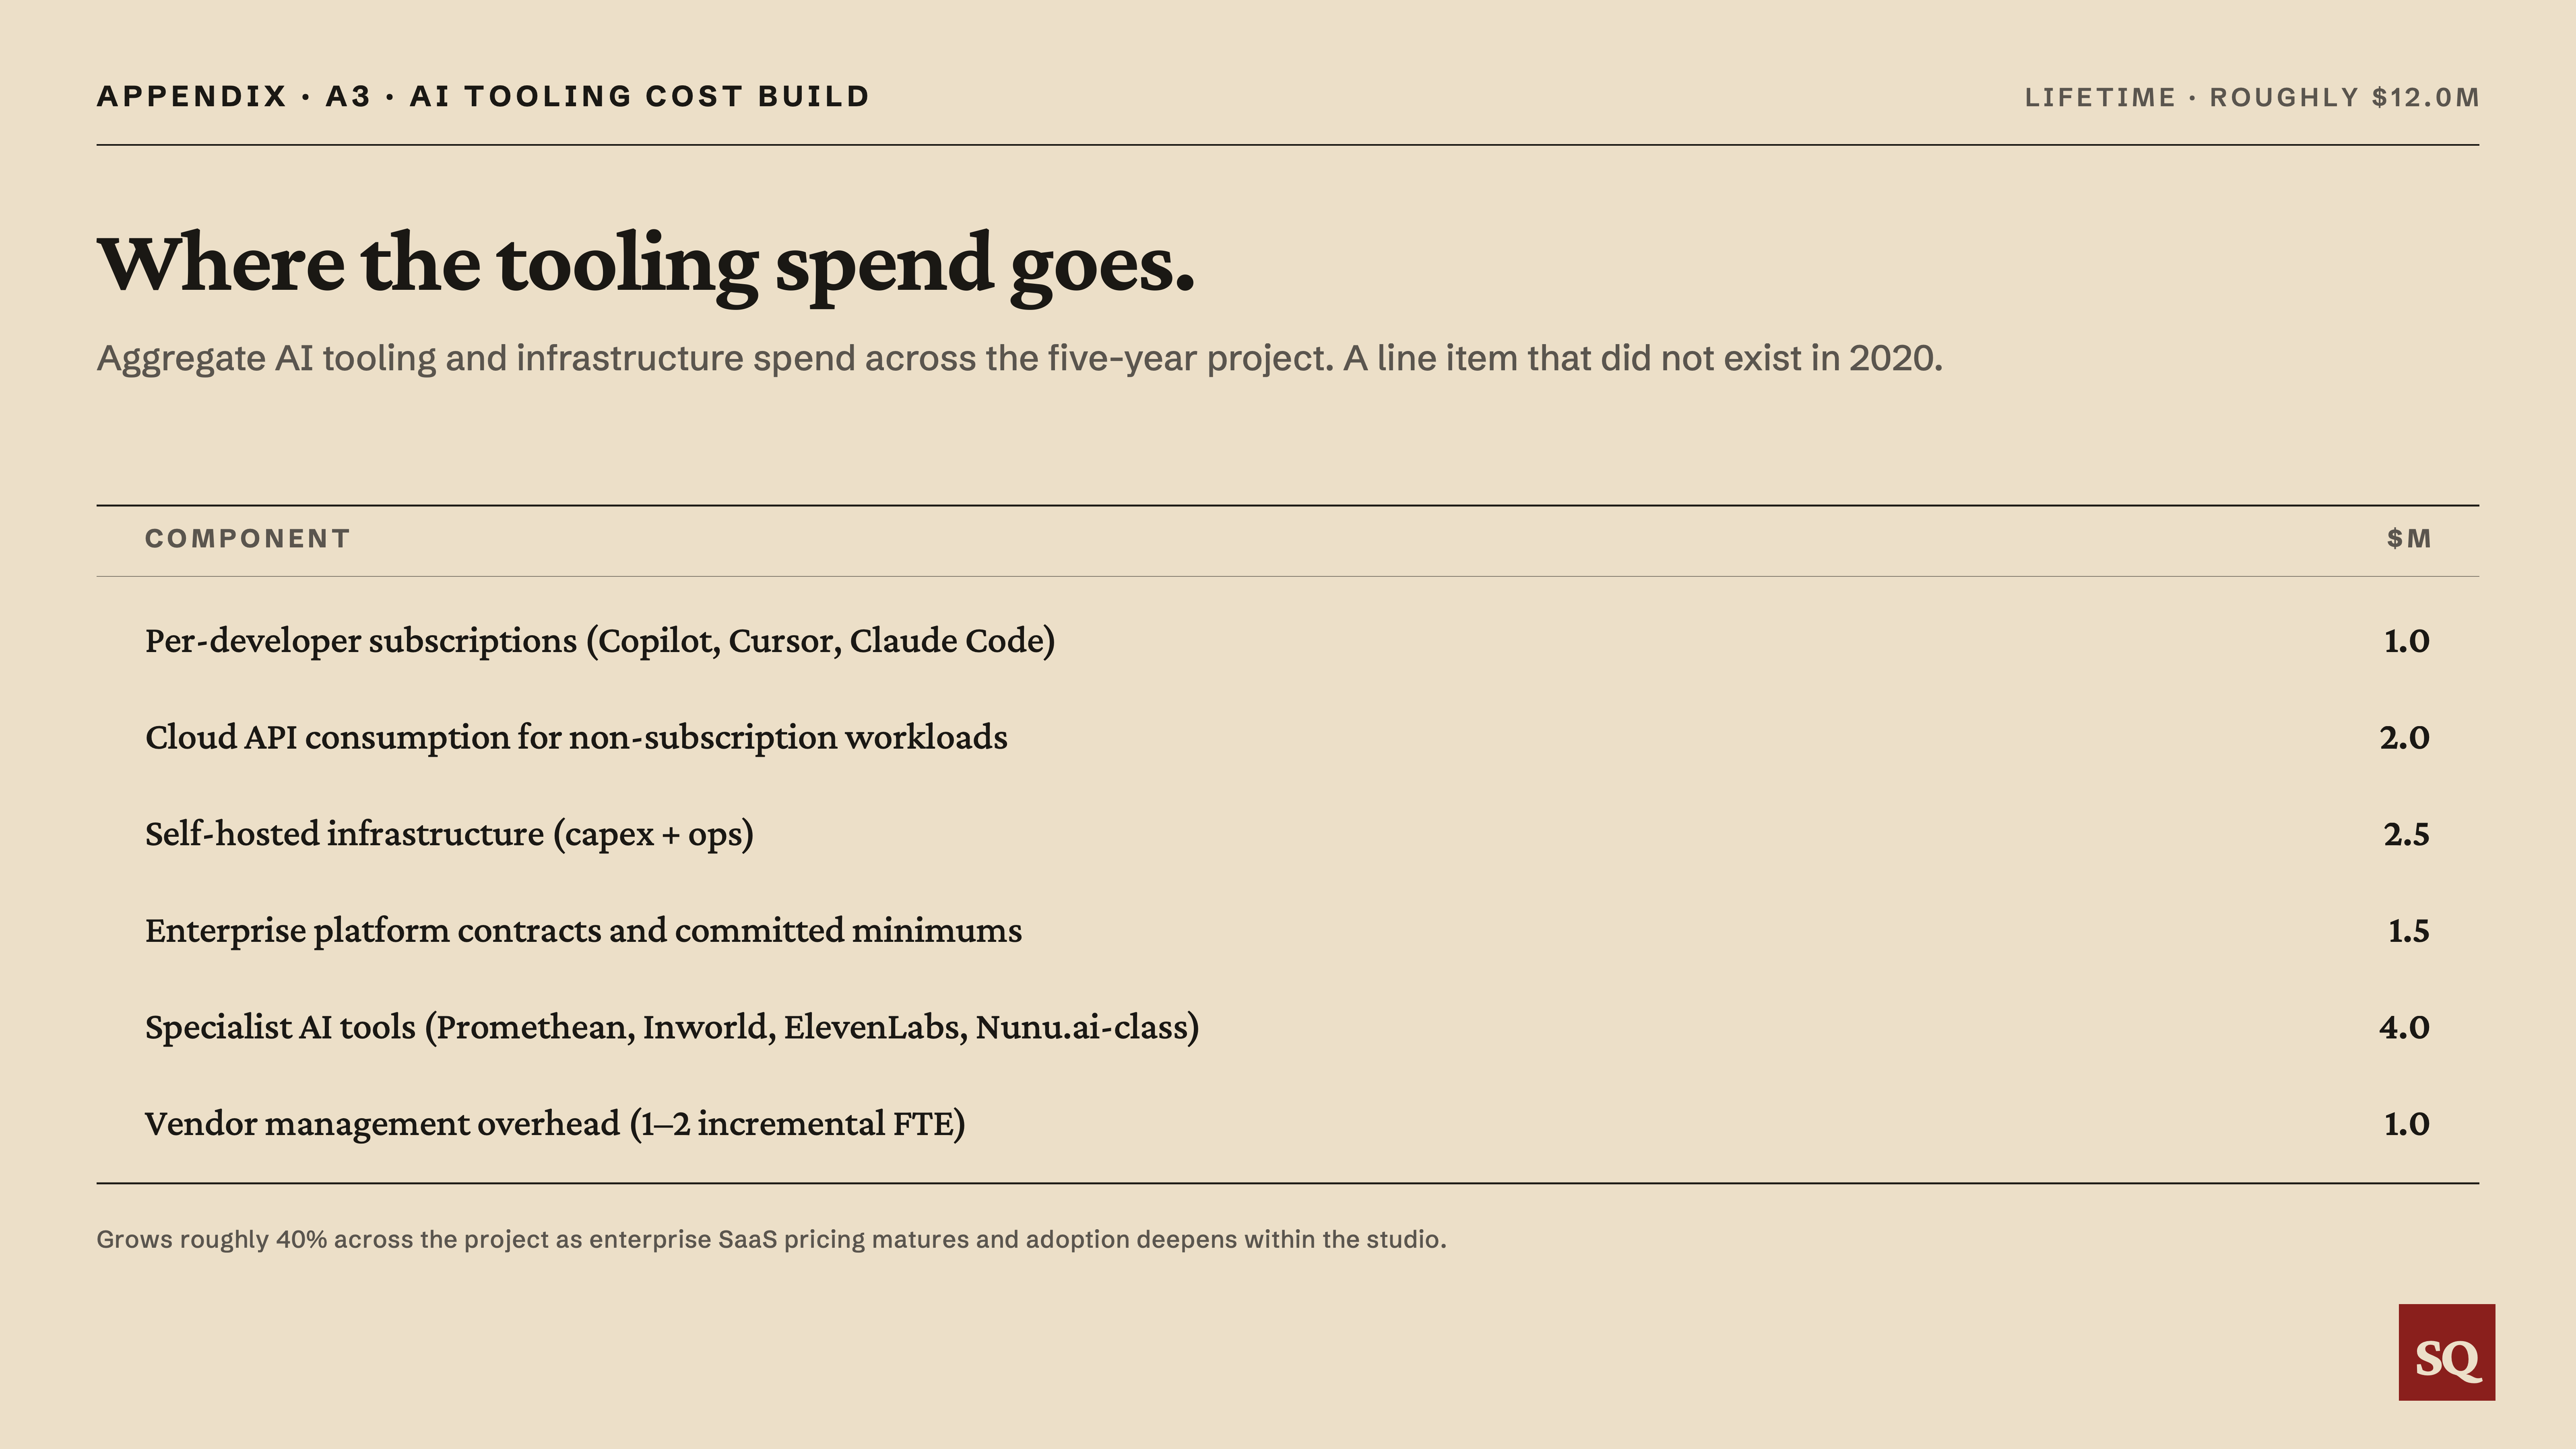
Across the five-year project, AI tooling and infrastructure costs aggregate to approximately $12m:
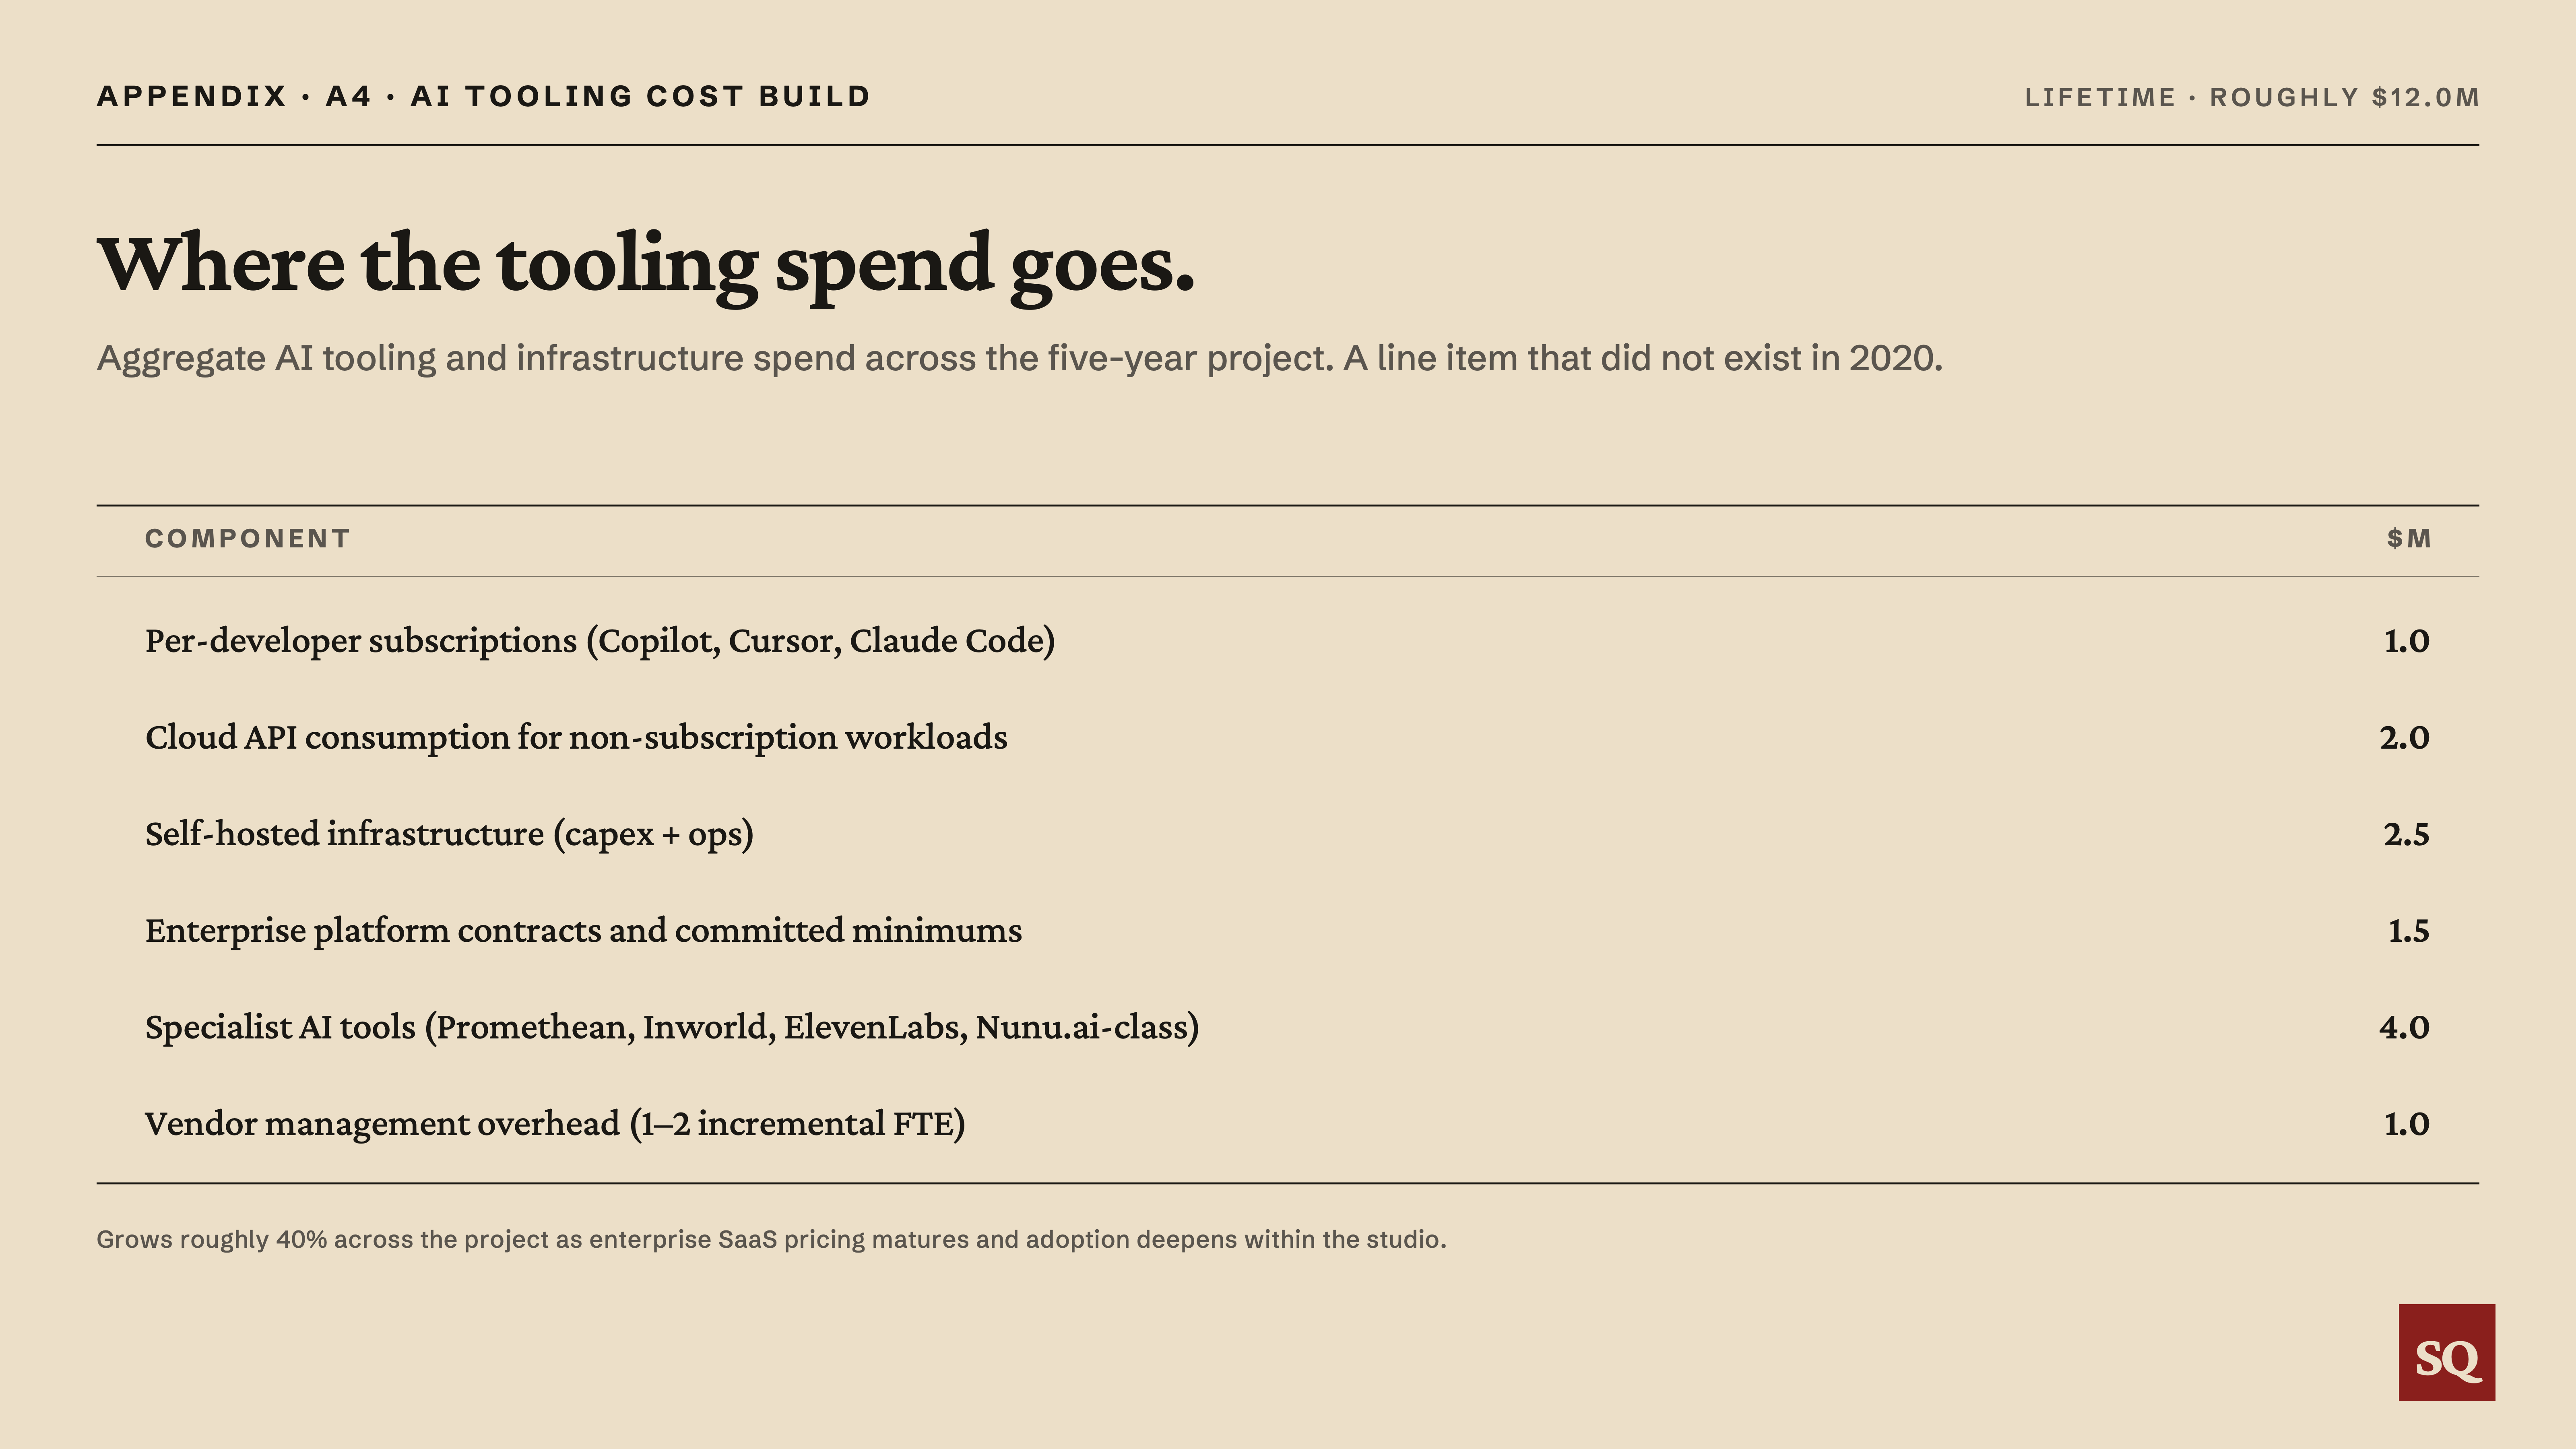
The figure grows roughly 40% across the project as enterprise SaaS pricing matures and adoption deepens within the studio.
A5. Aggregate offsets
The non-tooling offsets (adoption friction, integration, legal review, skill transition, senior comp inflation) total roughly $10m. The senior comp inflation line is the AI-specialist scarcity premium above the 3.5% blended wage inflation already applied in the base case, not a re-count of it. Combined with the $12m of AI tooling and infrastructure cost in A4, these account for $22m of production cost offsets. A further $1m of offsets falls on marketing cost (localised marketing assets and store creative absorbed by AI marketing tooling spend), bringing the total to the $23m of offsets shown in the lifetime P&L bridge.
A6. Adoption ramp and pricing trajectory
Salary inflation: internal labour is inflated at a 3.5% blended rate (component assumptions: 3% general, 5% senior creative and engineering), and external outsourcing at 2%.
The 1.4× AI tooling pricing factor by 2030 (7-9% a year) is anchored against three forces.
Negotiated enterprise SaaS renewal escalators run ~3-7% (Vendr); broad SaaS list-price inflation ran into double digits in 2024 (industry trackers).
AI tooling specifically has moved faster: Cursor launched a $200/month Ultra tier in June 2025, a 10× step over its $20 Pro tier for heavy users, and GitHub shifted Copilot to usage-based billing from June 2026, exposing heavy agentic users to overage costs above the flat seat price.
The deeper pressure is vendor economics: the major labs and coding-tool vendors remain loss-making (OpenAI guided to c$14bn of losses in 2026; Anthropic reached its first profitable quarter only in Q2 2026; Cursor ran negative gross margins into late 2025), so even as per-token inference costs fall, the direction of travel on price is up, because usage scales faster as AI embeds into pipelines.
The 1.4× sits modestly above negotiated-SaaS escalation and well below the AI-specific moves seen to date.
A7. Cash flow and balance sheet assumptions
Working capital schedule built from three DPO assumptions. Outsourcer payment terms 43 days, anchored on Keywords Studios’ disclosed FY2023 DSO (last public disclosure before EQT take-private in 2024). AI vendor billing terms 30 days, industry standard across Anthropic, GitHub Copilot Enterprise, AWS Bedrock, Cursor, and Azure OpenAI invoiced services. AI vendor prepaid balance 45 days on a blended basis, reflecting ~25% of AI vendor spend on annual upfront commitments and ~75% on monthly billing. The resulting permanent WC drag is roughly $0.3m over the project life. Capex of $2.5m on on-prem GPU infrastructure, depreciated over 4 years on a straight-line basis, dominates the early-year cash flow texture.
Cash flow timing assumptions:
Working capital builds years 1-3 and remains permanently elevated; modest scale (~$0.3m)
Cash capex front-loaded years 1-2 ($1.5m / $1.0m)
Depreciation evenly distributed years 1-4 at $0.625m per year
A8. AI vendor landscape by P&L line
The companies capturing AI productivity value across the AAA P&L cluster by function. The list is not exhaustive; it captures vendors with disclosed funding and adoption signals as of early 2026. How publishers and engine providers actually engage splits into four modes, and only one returns value to the publisher’s own operating line:
Licensing and integration: Krafton built its Co-Playable Character on NVIDIA’s ACE digital-human suite, shown at CES in January 2025 and shipping in inZOI (”Smart Zoi” NPCs, March 2025) and the PUBG franchise; ACE also powers NPCs in NARAKA: Bladepoint. These are integrations of a vendor’s technology, paid for in licensing and compute.
Co-development partnerships: EA partnered with Stability AI in October 2025 to co-develop generative models and tools for art and environment workflows, with Stability embedding its 3D research team inside EA. The value created is shared with, and substantially captured by, the vendor.
Strategic investment: Inworld AI, the best-funded NPC-dialogue vendor, raised over $50m at a $500m-plus valuation in 2023 with Microsoft’s M12 fund among its backers, and counts NetEase among its game partners. The publisher-adjacent money buys a minority stake in the vendor, not ownership of the technology.
Building in-house: Microsoft Research, with Xbox’s Ninja Theory, built Muse, a “World and Human Action Model” published in Nature in February 2025 and trained on the game Bleeding Edge. Ubisoft built its Ghostwriter dialogue tool (GDC 2023) and NEO NPC prototype (GDC 2024) internally, with NVIDIA and Inworld as technology partners rather than acquisitions.
Outright acquisition is rarer: Sony acquired Cinemersive Labs in 2026, folding its 2D-to-3D machine-learning team into SIE’s Visual Computing Group. Engine owners bundle rather than buy: Epic integrated its MetaHuman toolset directly into Unreal Engine 5.6 in June 2025 and changed the licence so MetaHumans can be used in Unity, Godot and other engines.
None of these routes hands the productivity gain back to the publisher for free. Licensing and integration pay the vendor in real time. Building a tool in-house capitalises its cost as salaries and compute. Acquiring a vendor capitalises into the purchase price the very value the vendor would otherwise have charged for. Vertical integration changes who books the margin inside the group; it does not, on its own, return the productivity gain to the publisher’s operating line. For the third-party publisher that licenses rather than builds, the capture leaks out as it is created.